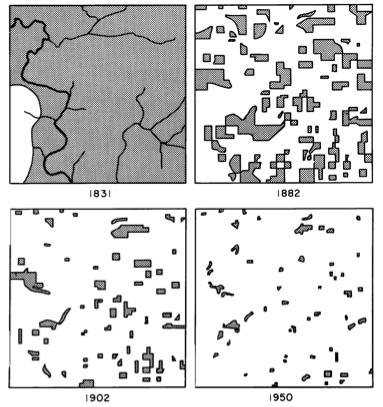
Buried in a dusty tome grandly titled Man’s Role in Changing the Face of the Earth lies a map that changed my life. Granted, my life was already headed in a direction amenable to this map’s wiles, but that lone figure’s influence cannot be understated. It is a simple map, or rather series of maps. Four panels, four dates—from left to right: 1831, 1882, 1902, and 1950. In each successive panel, the dark swaths of ink that represented forest cover in Cadiz Township, Wisconsin, grew successively smaller and more fragmented. In that one figure, John T. Curtis posthumously changed my life.

Growing up in southeastern Wisconsin, I was always peripherally aware that the forest fragments I frequented had not always been mere fragments. But Curtis’s map drove the point home. His fragments were dead ringers for my fragments. His maps were my environmental awakening, but in black-and-white.
Curtis grew up in Waukesha, Wisconsin, the same place my grandfather lives. He attended Carroll College—also in Waukesha—for his AB and then moved 65 miles west to Madison for his PhD. Curtis more or less remained in Madison till his death in 1961, proving that you don’t have to go far to accomplish big things. Curtis is best known within the ecological community for his work with Roger Bray on ordination, a statistical technique that enables botanists to make sense of the distribution, frequency, and abundance of plant species on a plot of land. His Cadiz Township maps are almost an afterthought, a minor footnote in an otherwise sweeping treatise on Wisconsin vegetation.
Unlike Bray-Curtis ordination, the Cadiz Township maps are astonishingly simple. The figure’s earliest frame depicts a wild Wisconsin, untamed by the plow and dominated by a grand deciduous forest the likes of which I sought as a kid. The scene rendered fifty-one years later in the second frame is entirely different. The smooth curve of the prairie-forest border is gone. Inky shards replace the previously continuous forest. In the third map, those bits grow smaller still. In the 1950 frame, the remaining woodlots are barely visible, like the last specks of glass from a broken platter waiting to be swept into a dustpan.
What makes Curtis’s map all the more remarkable was that he recreated the scenes from survey data and his own observations, painstakingly piecing together handwritten records of the six-by-six mile township. To my knowledge, it is one of the first visual reconstructions of fragmentation-as-it-happened, and one of the most influential—at least to me.
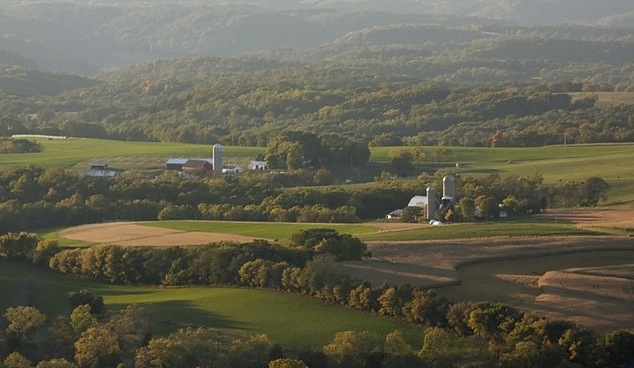
Photo by Ron Wiecki.
Related posts: