Shortly after I started Per Square Mile, I produced an infographic that showed how big a city would have to be to house the world’s 7 billion people. There was a wrinkle, though—the city’s limits changed drastically depending on which real city it was modeled after. If we all lived like New Yorkers, for example, 7 billion people could fit into Texas. If we lived like Houstonians, though, we’d occupy much of the conterminous United States.
Here’s that infographic one more time, in case you haven’t seen it:

What’s missing from it is the land that it takes to support such a city. In articles and comments about my infographic, some people overlooked that aspect—either mistakenly or intentionally. They shouldn’t have. Cities’ land requirements far outstrip their immediate physical footprints. They include everything from farmland to transportation networks to forests and open space that recharge fresh water sources like rivers and aquifers. And more. Just looking at a city’s geographic extents ignores its more important ecological footprint. How much land would we really need if everyone lived like New Yorkers versus Houstonians?
It turns out that question is maddeningly difficult to answer. While some cities track resource use, most don’t. Of those that do, methodologies vary city to city, making comparisons nearly impossible. Plus, cities in most developed nations still use a shocking amount of resources, regardless of whether they are as dense as New York or as sprawling as Houston. Any comparison of the cities in my original infographic would be an exercise in futility at this point.
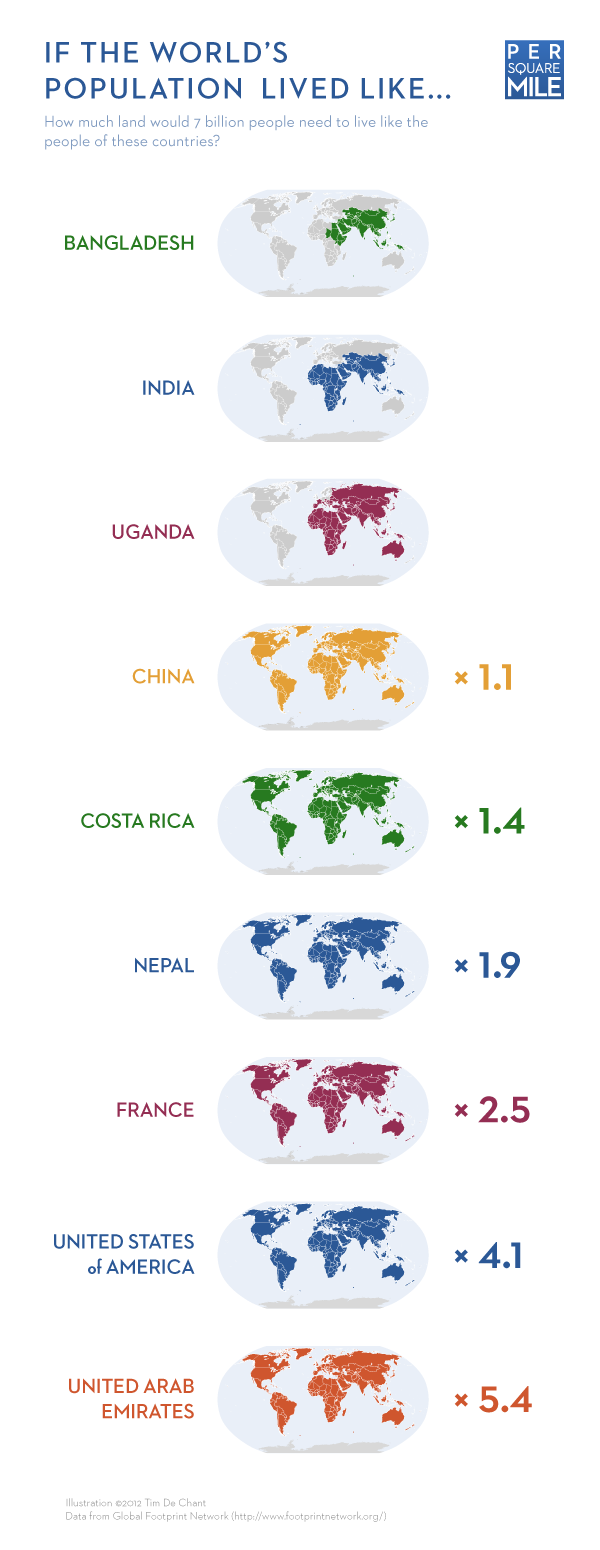
But what we can do is compare different countries and how many resources their people—and their lifestyles—use. For countries, the differences are far, far greater than for cities. Plus, there’s a data set that allows for reliable comparisons—the National Footprint Account from the Global Footprint Network. Their methodology is based on peer-reviewed research by Mathias Wackernagel, the organization’s founder. It’s consistent and comprehensive. Each country’s footprint is assembled from sub-footprints, ranging from cropland to carbon to urbanization to fishing grounds. For my purposes, I used only terrestrial sub-footprints. I’ll let the results speak for themselves.
Sources:
Global Footprint Network. 2011. National Footprint Accounts, 2011 Edition.
Wackernagel, M., Kitzes, J., Moran, D., Goldfinger, S. & Thomas, M. (2006). The Ecological Footprint of cities and regions: comparing resource availability with resource demand, Environment and Urbanization, 18 (1) 112. DOI: 10.1177/0956247806063978
Related posts:
If the world’s population lived in one city…
Spare or share? Farm practices and the future of biodiversity