Why we live in dangerous places

Great Wave off Kanagawa, Hokusai

This post originally appeared on Scientific American’s Guest Blog.

Natural disasters always seem to strike in the worst places. The Sendai earthquake has caused over 8,000 deaths, destroyed 450,000 people’s homes, crippled four nuclear reactors, and wreaked over $300 billion in damage. And it’s only the latest disaster. Haiti will need decades to rebuild after its earthquake. New Orleans still hasn’t repopulated following Hurricane Katrina. Indonesia still feels the effect of the 2004 tsunami. The list could go on and on. The unfortunate lesson is that we live in dangerous places.

We have built civilization’s cornerstones on amorphous, impermanent stuff. Coasts, rivers, deltas, and earthquake zones are places of dramatic upheaval. Shorelines are constantly being rewritten. Rivers fussily overtop their banks and reroute themselves. With one hand, earthquakes open the earth, and with the other they send it coursing down hillsides. We settled those places for good reason. What makes them attractive is the same thing that makes them dangerous. Periodic disruption and change is the progenitor of diversity, stability, and abundance. Where there is disaster, there is also opportunity. Ecologists call it the “intermediate disturbance hypothesis.”

This post was chosen as an Editor's Selection for ResearchBlogging.orgThe intermediate disturbance hypothesis is one answer to an existential ecological question: Why are there so many different types of plants and animals? The term was first coined by Joseph Connell, a professor at UC Santa Barbara, in 1978.¹ Connell studied tropical forests and coral reefs, and during the course of his work, he noticed something peculiar. The places with the highest diversity of species were not the most stable. In fact, the most stable and least disturbed locations had relatively low biodiversity. The same was true of the places that suffered constant upheaval. But there, in the middle, was a level of disturbance that was just right. Not too frequent or too harsh, but also not too sparing or too light. Occasional disturbances that inflict moderate damage are, ecologically speaking, a good thing.

To see how this works, let’s imagine a hypothetical forest, one that escapes disturbance for thousands, even millions of years. Eventually, it will be dominated by two species—a tree species that is best adapted to the type of soil, quantity of water, and amount of sunlight, and an understory species that can best cope with limited sunlight under the canopy. No other species could possibly compete; eventually, two species would become the best plants for the conditions. While it’s a gross generalization, it illustrates the point. Stable environments can stifle diversity.

This would not be the case in a more realistic forest, however, one that suffers from the periodic fallen tree, occasional fire, or odd tornado. In the window opened by disturbances, other species would have ample opportunity to gain a foothold. If a tree falls, other species could bolt toward the sun. After a fire, herbs that sprout vigorously would have a leg up on previously dominant plants that bud languorously. Life explodes into the openings when given new opportunities.

Biodiversity has flourished where the occasional disturbance kicks open a door. These places are also all the more stable for it. Diversity breeds stability. They are also richer in food and resources, two qualities that attracted our ancestors. The natural bounty of those places made the occasional hurricane or tsunami tolerable.

Today, many of us don’t have the same problems our forebears did. We don’t need to live next to our food. Our water comes from a tap. We can drop our packages off at the post office. But the past is hard to escape. While the requirements of the last century may have disappeared, our cities have not. We are creatures of habit.

Yet social inertia is not the only reason we still live in dangerous places. As aesthetically tuned creatures, we crave dramatic landscapes forged by catastrophe. California is celebrated for its tectonic rocky shores. Mount Saint Helens almost certainly has more visitors now than before it blew its top. The Mississippi River is responsible for untold hardship, yet it’s held up as an honored piece of Americana.

That’s not to say that the Sendai earthquake or the Australia’s Black Saturday bushfires will be lauded in the future. They are more than intermediate disturbances—they are real disasters. Yet in ecological terms, each would have been a small speed bump. What turns intermediate disturbances into natural disasters is population density. Earthquakes didn’t kill when our buildings didn’t require stairs. And though tsunamis still have always been devastating, they caused few human casualties before we built cities. Avalanches in remote parts of Alaska don’t usually raise eyebrows, but they are a constant concern for many villages in the Swiss Alps. Much of the handwringing over sea level rise is precisely because so much of the world’s population lives near the ocean.

That’s not to say we should flee the coasts or abandon the breathtaking but dangerous places. Our fear of change may seem like a hindrance, but our stubbornness is also one of our greatest assets. Without overcoming intermediate disturbances like floods or sandstorms, there would be no Rome or Cairo. We live on a tumultuous planet where life has thrived under a regime of constant upheaval. Adapting is—and always has been—our last, best hope.


  1. Though he coined the term, two previous studies had described essentially the same concept.

Source:

Connell JH (1978). Diversity in tropical rain forests and coral reefs. Science (New York, N.Y.), 199 (4335), 1302-10 PMID: 17840770
Paying for proximity: The value of houses near train stations

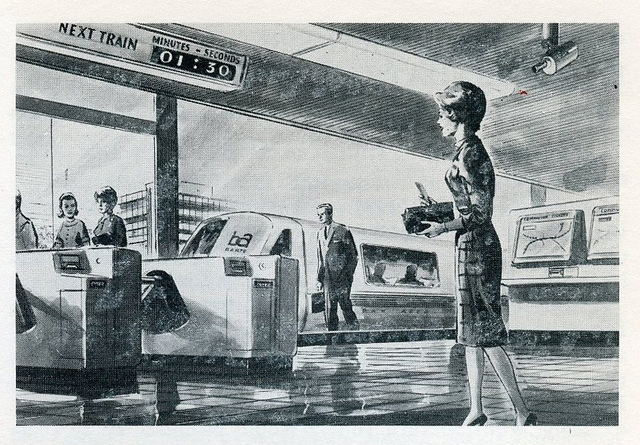
BART station illustration, 1967

“You can’t get there from here” are words people seldom like to hear. Nor do they like being stuck in traffic jams. Or walking miles to get home from a train station or bus stop. People will pay good money for a house that can offer them an easy way to get to point B, wherever that may be.

Proximity to a freeway used to be the way to go, but in the face of increasing congestion, trains are an attractive way of doing the A-to-B thing. Trains glide past stalled traffic, and their riders are free to do whatever they choose. Compared to buses, trains are also relatively fast and smooth. In fact, they are such an attractive transportation proposition that when a new lines snakes out from a city, houses follow. But realtors would also have you believe another old saw—that a house near a train station is worth more than one that’s not.

It’s true that in many places real estate with nearby rail access is more expensive, but there are a number of other factors that could drive prices other than proximity to a station. Good schools often attract buyers, as do conveniently located grocery stores and shops. Despite these confounding variables, there are a number of studies that show train stations are, in fact, behind a rise in neighboring property values.

One early study found the San Francisco Bay Area’s BART system had a big impact on housing prices near its stations—before it even opened. Between 1960 and 1967, prices within six blocks of the future Glen Park station in San Francisco rose more rapidly than the overall average for the Outer Mission district in which it was located. Another study discovered that house prices in many neighborhoods on Chicago’s southwest side benefitted from the opening of the Orange Line, which runs from the Loop (Chicago-speak for “downtown”) to Midway Airport. Just six years after the line opened, houses within 1.5 miles of the new stations appreciated in value almost 7 percent more than houses farther away.

The effect was also seen in London in the late 1990s when new stations were added to the Underground and Docklands Light Railway in South East London. Overall housing prices in the area rose 9.3 percent as a result, and people who lived closer saw even better returns. Frequency of service had an effect in London, as well. Houses near stations for Network Rail, a main line service that runs on average half as frequently as the Tube and light rail, fetched more when trains ran more frequently. One additional train per hour added 0.2 percent to a home’s value.

It even appears that easy train access is a bigger incentive to spend more for a house than good schools. In that same London study, houses that were one-quarter standard deviation closer to a train station appreciated more than twice as much as those near a school that was one-quarter standard deviation better in terms of performance. I suspect part of the difference is because trains are an amenity that appeals to more people than schools—not everyone has children, after all. It goes to show just how much people will pay for convenience.

Sources:

Davis, F.W. (1970). Proximity to a rapid transit station as a factor in residential property values The Appraisal Journal, 554-572

Gibbons, S., & Machin, S. (2005). Valuing rail access using transport innovations Journal of Urban Economics, 57 (1), 148-169 DOI: 10.1016/j.jue.2004.10.002

McMillen, D.P., & McDonald, J. (2004). Reaction of House Prices to a New Rapid Transit Line: Chicago’s Midway Line, 1983–1999 Real Estate Economics, 32 (3), 463-486

Original BART illustration posted by Eric Fischer.

Related post:

Do people follow trains, or do trains follow people? London’s Underground solves a riddle

Proximity sans convenience: Houses near train tracks and freeways

Managing landscapes for aesthetics

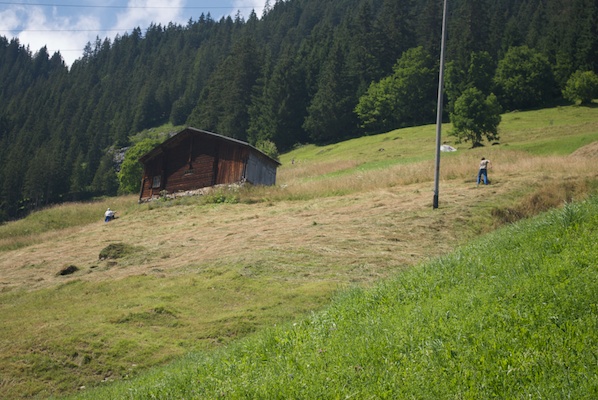
Managed landscape in Gimmelwald, Switzerland

Aesthetics may have more to do with protecting land as a nature reserve than we would like to admit. Wetlands are a perfect example. Few people would consider wetlands to be “beautiful” landscapes—they offer few vistas, are difficult to navigate, and can appear rather homogeneous to the layperson. To many, a swamp is a swamp is a swamp.

Conservation success may lie in managing these landscapes not only for their natural functions but their appearance as well. Though this may seem antithetical to the some environmentalists, in reality nearly all landscapes are managed by people, either through action or inaction. The North American landscape 500 years ago was shaped by American Indians and their use of fire. Decades of fire suppression have played a similar role, albeit with strikingly different results.

Fire suppression has drastically altered one national treasure in the U.S.—Yosemite. Ponderosa pine trees have grown into curtains that block many famous vistas and choke the once open valley floor. In response, the National Park Service has a plan to restore many now veiled vistas. Similar discussions are taking place on Europe, where countries are working to implement the European Landscape Convention, which seeks to preserve the character of the countryside. Such plans likely have their detractors. After all, planning with such a broad brush is subjective, and not everyone’s opinions will be the same.

One study, though, did find a few overarching themes. It explored the link between people’s aesthetic preferences and cold, hard measures of landscape complexity. Participants were shown a series of computer-generated images of fictional landscapes, each carefully constructed to reflect a different measure of landscape complexity, and asked which they preferred. Time and again people selected scenes with fairly specific qualities: They preferred vistas looking onto two types of cover, such as forest and grassland, that occurred in uneven amounts—more of one or the other was most pleasing. They also were drawn to views where the cover types were clumped here and there, as opposed to aggregated in two giant swaths.

Unfortunately, reality may not be that straightforward—the study is not without its shortcomings. First, the authors presented each image from two different viewpoints, and participants preferred the second viewpoint more than the first. It’s a pattern that screams for explanation, of which there was little. Also, the images were computer generated. Though this let the researchers manipulate the landscapes as they pleased, the images did not have the allure of a real photograph, which may have turned off some participants. Lastly, the survey participants were all Scottish, so the results may be skewed by a preference for their native landscape, one that is dominated by two cover types—forests and grassland. Not only is this a decidedly Western view, it’s a particularly local one.

There are more studies on landscape preference that I’ll be covering in the future, but this one stood out for its desire to link preference with concrete measures of landscape complexity. It’s a good first step, and one I’d like to see followed with studies that use photographs of real landscapes—with the metrics derived from satellite or aerial photographs—that are shown to people of many different cultures. Perhaps then some general trends will emerge.

Source:

Ode, A., & Miller, D. (2011). Analysing the relationship between indicators of landscape complexity and preference Environment and Planning B: Planning and Design, 38 (1), 24-40 DOI: 10.1068/b35084

Photo by the author.

Hidden cost of sprawl: Getting to school

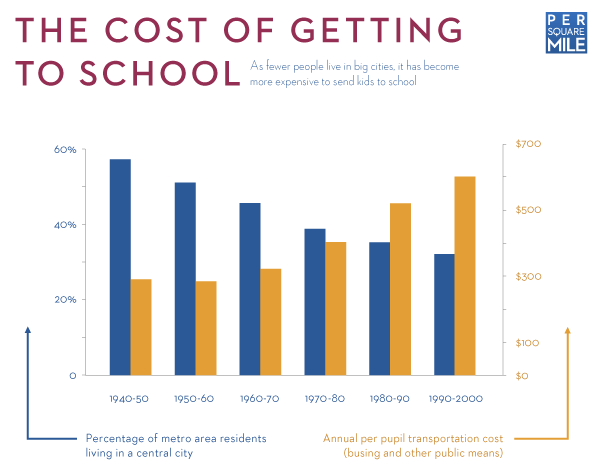
The cost of getting to school

click for more detail

Chalk it up to the law of unintended consequences. As Americans have flocked to the suburbs for the lower cost of living, the cost of sending their kids to school has gone up. Where most kids used to walk to school—myself included—nowadays many simply live too far away. While some students get rides from their parents, many are left to take the bus, an option that is funded by districts. But as kids travel farther to get to school, the costs for busing them have also gone up.

Fully 56 percent of people living in metropolitan areas in 1950 resided in their region’s big city (or cities). By 2000, that proportion had dropped to 32 percent. At the same time, the cost of sending kids to school has increased from $289 per student to $737 per student.¹ It might be tempting to blame gas and diesel prices, but they aren’t responsible—they’ve remained largely constant over that time period when adjusted for inflation (except for the energy crisis in the 1970s). Yet the trend in student transportation costs has risen unabated. Though the outlay may not seem significant, it is money that would be spent more effectively in the classroom.


  1. All costs are inflation adjusted to 2007 dollars.

Sources:

Boustan, Leah Platt, and Allison Shertzer. 2010. Demography and Population Loss from Central Cities, 1950-2000. California Center for Population Research Working Paper PWP-CCPR-2010-19. Available online.

U.S. Department of Education. 2009. Digest of Education Statistics. Table 147.

Are wildlife diseases cities’ next public health problem?

Raccoon chows down a pumpkin

Cities were nasty, filthy places to live until very recently. For many people in slums around the world, this remains a cruel part of life. The place that holds the most opportunity also harbors disease and illness. People have been grappling with the ill effects of population density for thousands of years, and most of the effort has focused on how to stop one person from getting another sick. But as cities’ populations boom, there’s another less considered and seemingly unlikely source of disease—wildlife.

This post was chosen as an Editor's Selection for ResearchBlogging.orgPeople and animals have a long history of trading diseases. The Black Death was caused by bubonic plague, a bacteria carried by fleas that typically infest rats and other rodents. HIV is widely believed to have first infected humans via contact with another species of ape. And though animals have given us a few beneficial diseases—cowpox, for example, which helped end smallpox—by and large, they’re something we’d rather avoid.

The collision of urban and rural areas has brought a number of diseases to our attention. Lyme disease has become a household name in much of North America thanks to expanding suburbs. As cities pushed out into old farm fields and forests, more people came into contact with the deer ticks that carry the bacteria that causes the ailment. A bite from a host tick causes a telltale bullseye rash followed by fever, headaches, and if left untreated, joint inflammation and nerve damage.

Rabies is another disease that can be problematic in cities, but unlike Lyme disease, it has a worldwide reach. Though dogs are the primary vector for humans, other canines such as raccoons provide a reservoir for the disease. As anyone who woken up to marauded garbage cans knows, raccoons are a big problem in North American cities (and in Germany, Japan, and parts of the former USSR, thanks to introductions). Raccoons thrive in human dominated landscapes: Our cities and towns are largely free of predators. They offer a variety of housing opportunities, and they come replete with buffets every night of the week—garbage night. The masked canines have made the most of it—their birth rates have skyrocketed. As their populations rise, there is more social contact and more probability for disease transmission. Nightly garbage feasts only compound this problem, bringing crowds of raccoons together. Rabies has become such a problem among raccoons that a study in Connecticut in the early 1990s discovered almost half the study population was infected.

For each common critter that is susceptible to a disease, it seems there are vulnerable species that are also threatened. Raccoon roundworm, for example, has taken its toll on the endangered Allegheny woodrat. Gray squirrels, which are not native to the United Kingdom, carry a virus which is lethal to native red squirrels. As gray and red squirrels come into contact at the same food sources in cities and suburbs, the likelihood of cross-species transmission increases. Even pets pose a threat to native fauna. Sea otters off the coast of California have come down with toxoplasmosis, the source of which was traced to urban runoff tainted with cat feces.

People once thought that cleaning up cities involved brooms, sewer systems, and potable water supplies. While those advances have gone a long way to making cities healthier, our inadvertent assistance of certain animals has raised an entirely new set of problems. Because of the wide range of diseases and hosts, the solutions will have to be varied. In the case of rabies, some areas are experimenting with oral vaccines for raccoons. But for other, more vulnerable species, the best solution may be to promote biodiversity and native landscapes. Landscapes filled with native plants would not only be less stressful for the animals—giving their immune systems a boost—they would also support more diverse fauna. A wider variety of animals within city limits would likely reduce the spread of some diseases by introducing new hosts, some of which may be better at fighting off pathogens.

Sources:

BRADLEY, C., & ALTIZER, S. (2007). Urbanization and the ecology of wildlife diseases Trends in Ecology & Evolution, 22 (2), 95-102 DOI: 10.1016/j.tree.2006.11.001

Wilson ML, Bretsky PM, Cooper GH Jr, Egbertson SH, Van Kruiningen HJ, & Cartter ML (1997). Emergence of raccoon rabies in Connecticut, 1991-1994: spatial and temporal characteristics of animal infection and human contact. The American journal of tropical medicine and hygiene, 57 (4), 457-63 PMID: 9347964

Photo by clarkmaxwell.

Eco-friendly fish farms

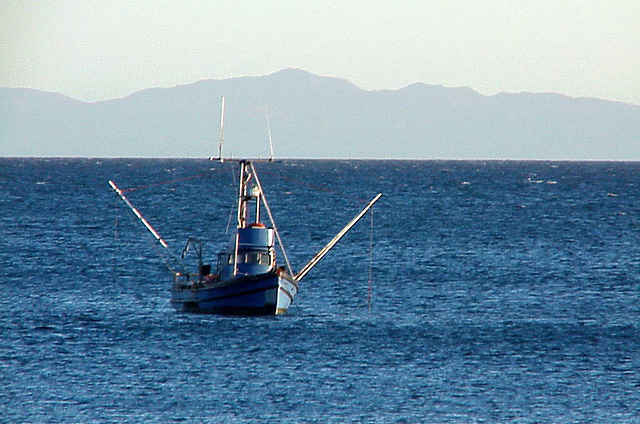
Fishing boat off the coast of California

Emotions have been boiling over in California as the decade-plus process of implementing the Marine Life Protection Act is finally coming to fruition. The end-game is the establishment of a series of reserves off the California coast. And while the state has a number of existing protected areas, they’re mere specks in comparison. The new network sets aside 16 percent of the state’s coastal waters, which scientists hope will stave off the effects of overfishing by creating safe-havens for fish and other marine life free from fishing.

Many fisherman, perhaps predictably, are questioning the reserves’ ability to both protect ocean life and boost catches. On one hand, they say the 16 percent target is too much, that it takes away too many of their favorite haunts. But on the other, they say 16 percent is too little, that the ocean needs systemic protection if there are to be any benefits at all. In a way, they’re right about the latter point. Human pressures have pushed a seemingly inexhaustible resource to the edge, and the best way to protect the ocean is an all-in approach. Short of that though, something needs to be done, and a network of marine protected areas is a good first step.

It’s true that marine reserves will remove a chunk of California’s coastal waters from fishing, but scientists supportive of the network say the protected areas will export fish to non-protected waters, creating more sustainable fisheries. Though some fishermen question this claim, research largely supports it.

Population density and diffusion are the name of the game. The barrier between the reserve and the rest of the ocean is porous—if the habitat is the same on both sides of the border, nothing is keeping the fish in the reserve except perhaps their own unwillingness to leave. One source of that unwillingness may be fishing pressure, but eventually densities will reach a point where fish are forced to venture out into unprotected waters. At that point, they’ll be fair game for the fishermen. The reserves would act as environmentally friendly fish farms, in a way, and research confirms that they can function as such. For example, small-time fishermen off the coasts of St. Lucia and the west coast of Spain reported higher catches near reserves.

A potential caveat, though, is the size of the fish that wander out of the reserves. As population densities increase within the protected areas, some fish may not reach their full potential. Think of goldfish in a fishbowl. With a smaller bowl or more companions, goldfish tend to stay small. Upgrade their digs, though, and that quickly changes. One study sought to test that idea by modeling a hypothetical fish based on the European plaice, a species caught commercially in the Mediterranean and North Atlantic and one that reaches different sizes depending on density. Indeed, the model predicted that smaller fish will result from denser populations. With marine protected areas, the total tonnage of fish caught may remain the same, despite an increase in the number of fish caught, the study’s authors said. Still, the model’s results depend on the type of fish, and the authors did not conduct a corresponding empirical study (though they did cite two papers that supported their findings).

Protected areas may not hold growth back for all species, however. Another paper—this one with field data from Florida—reported that more world record-sized fish were caught in waters neighboring reserves than in the rest of the state.

Most studies find marine reserves benefit fish stocks, but one in particular says they are absolutely necessary to stave off the collapse of fisheries. Like many other studies, it found that protected areas raised populations enough to mostly or fully offset any shortfalls in catches that resulted from closing parts of the ocean to fishing. This paper went further, though, and reviewed studies of 14 different of fisheries around the world, concluding that all but two would be unsustainable without reserves.

Part of the strength of California’s marine protected areas is the fact that they are a planned network rather than a loose handful of reserves. Individual reserves are beneficial—one study noted many depressed populations bounce back quickly once protected—but a network can aid species that require large swaths of ocean without setting aside tens of thousands of square miles. Networks of protected areas allow fish and other marine organisms to catch their breath, which in turn will likely bring some fisheries back from the brink. With luck, this also means fishermen will be plying the oceans a bit longer.

Sources:

Gaines, S., White, C., Carr, M., & Palumbi, S. (2010). Marine Reserves Special Feature: Designing marine reserve networks for both conservation and fisheries management Proceedings of the National Academy of Sciences, 107 (43), 18286-18293 DOI: 10.1073/pnas.0906473107

GÅRDMARK, A., JONZÉN, N., & MANGEL, M. (2005). Density-dependent body growth reduces the potential of marine reserves to enhance yields Journal of Applied Ecology, 43 (1), 61-69 DOI: 10.1111/j.1365-2664.2005.01104.x

HALPERN, B., LESTER, S., & KELLNER, J. (2010). Spillover from marine reserves and the replenishment of fished stocks Environmental Conservation, 36 (04), 268-276 DOI: 10.1017/S0376892910000032

Halpern, B., & Warner, R. (2002). Marine reserves have rapid and lasting effects Ecology Letters, 5 (3), 361-366 DOI: 10.1046/j.1461-0248.2002.00326.x

Roberts, C. (2001). Effects of Marine Reserves on Adjacent Fisheries Science, 294 (5548), 1920-1923 DOI: 10.1126/science.294.5548.1920

Stobart, B., Warwick, R., González, C., Mallol, S., Díaz, D., Reñones, O., & Goñi, R. (2009). Long-term and spillover effects of a marine protected area on an exploited fish community Marine Ecology Progress Series, 384, 47-60 DOI: 10.3354/meps08007

Photo by Splinter Group.

The roadless neighborhoods of Radburn, New Jersey

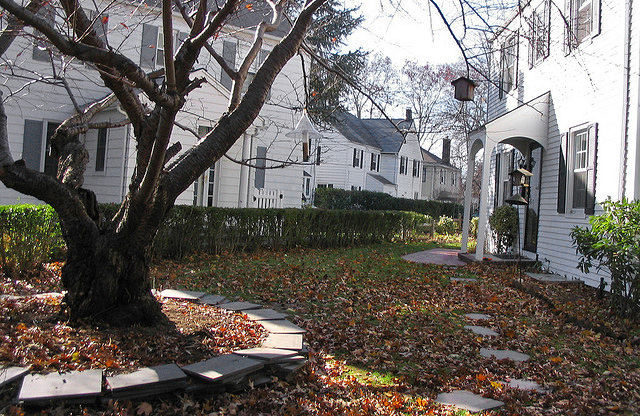
Walkway in Radburn, New Jersey

Planners looking to imbue their development with a little old school appeal have a best friend in alleys. The petite thoroughfares tuck bland garage doors behind friendlier looking houses, shrink lots to squeeze in more housing, and leave sidewalks and streets that are free of driveways and curb cuts. Alleys have their charm, I admit. They harken back to the day when they hosted neighborhood stickball games or were the best place to ride a bike. New Urbanists—planners, architects, and developers who seek to recreate Small Town, U.S.A.—have latched on to alleys. They claim that the narrow passages leave a streetscape that’s friendlier to pedestrians. It’s a good argument, but I think New Urbanists just have a bad case of nostalgia.

Here’s why: If pedestrian friendliness and walkable neighborhoods are really what New Urbanist planners seek, then they would do away with the alley entirely. Well, not entirely. Rather, they would pick up a neighborhood’s roads and plop them down in place of the alleys. In the street’s place would be narrower pedestrian and bike paths. The roadway would remain behind the houses, functioning as an alley in spirit while feeding roads that carry traffic to larger arterials. People and cars could both travel in relative peace.

The separation of foot and vehicle traffic sounds like a brilliant idea, one that could bequeath neighborhoods with New Urbanist density and pedestrian friendliness while preserving a bit more space for yards and gardens. In fact, I think it’s so brilliant that I wish I could claim it as my own. Alas, I cannot. Credit goes to Clarence Stein, Henry Wright, and Marjorie Sewell Cautley, the planners of Radburn, New Jersey.

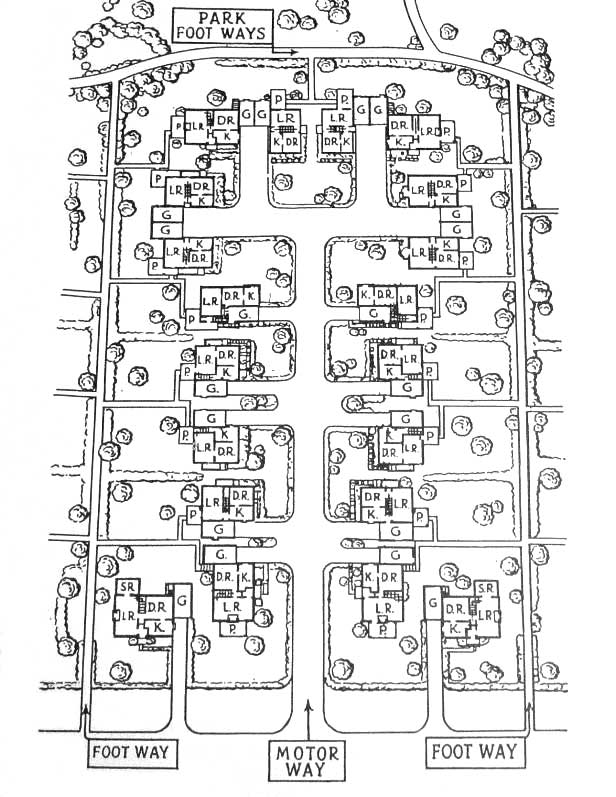
Radburn cluster planRadburn was cooked up in the 1920s. At the time, the success of the automobile encouraged experimentation with city plans. The Radburn plan was at the cutting edge. Cars brought a new freedom of movement that many planners translated into larger lots and sweeping lanes that evoked the countryside, à la Frank Lloyd Wright’s proposed Broadacre City. But Stein, Wright, and Cautley took things in a slightly different direction, shrinking roads and lots back to more manageable sizes.

I first read about Stein, Wright, and Cautley’s plans for Radburn in The American City: What Works, What Doesn’t. It was the plan’s walkways that captured my imagination. They weren’t just footpaths—they were spiritual successor to the road. Front doors opened on to the paths. Pedestrians never had to worry about vehicular traffic. Instead, the footways passed under streets, keeping dangerous automobiles separate from pedestrians—especially children walking to school.¹ Since I read about Radburn, I’ve been so taken by the idea of “roadless” neighborhoods that they’ve backdropped my dreams. I kid you not. I often walk through Radburnesque towns in my sleep-induced hallucinations.

Alas, Radburn was never finished. Its pioneering planners and their model city ran smack into the financial realities of the Great Depression. Only one of the pedestrian underpasses—what was to be one of Radburn’s signature elements—was built. Instead, Radburn is best known for introducing the 20th century to the cul-de-sac and the superblock, a collection of streets bounded by four major arterial roads. Alexander Garvin, author of The American City, says these two planning concepts were “so much more important” than the footpaths and their underpasses. He was certainly right about their role in the last century, but I’d like to think the next hundred years will prove him wrong.


  1. An interesting side note: Radburn’s planners defined each neighborhoods by the “population for which one elementary school is ordinarily required”.

Source:

Alexander Garvin (2002). Residential Suburbs The American City: What Works, What Doesn’t, 305-343 ISBN: 0071373675

Photo by themikebot.

Related post:

It’s not the yard that matters, it’s the view

When greenbelts fail

Leapfrog suburb in the Easy Bay, California

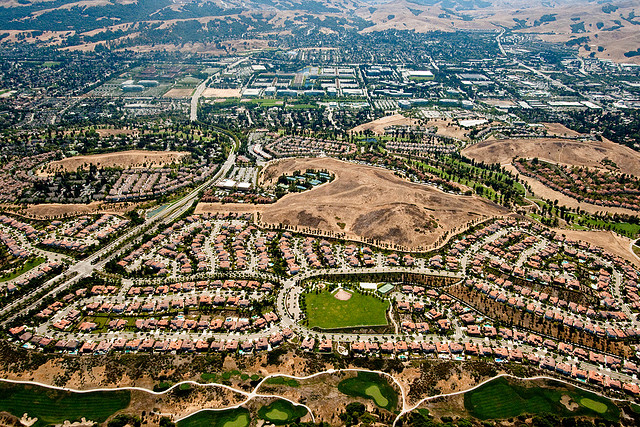
Parks are often preservationists’ first line of defense against sprawl. To many, they’re a win-win arrangement—less rambling development and more open space. But the same qualities that make them attractive to planners—higher property values, more recreational opportunities, and pleasing aesthetics—also draws new residents, undermining their sprawl-fighting virtues.

Greater London and the San Francisco Bay Area are good examples of the failure of greenbelts to stem outward expansion and encourage upward growth. Regional parks surrounding the core metropolitan area have become assets for communities outside the belt, attracting residents. So long as people have an expedient way to get to work, they’ll happily sacrifice proximity to work for a little patch of sunshine and greenery they can easily visit.

That’s the mechanism behind suburbs that leapfrog parks and greenbelts, according to two resource economists. They created sophisticated models that produced simplified SimCity maps that allowed them to see how parks of different sizes and shapes could change development patterns. Without parks, cities appeared as perfect circles on the map, with the highest density areas in the middle. The addition of a park, however, drew people away from downtown, creating a second locus of high-density development around it much the same way Central Park has attracted Manhattanites. But they found that if New York had an attractive space like Central Park outside of city limits, its population would be smeared across the landscape like butter on bread rather than centered on Manhattan like a dollop of ice cream. Typical parks with low perimeter-to-area ratios tend to affect development this way.

Greenbelts on the other hand have gobs of perimeter, making them easy to access for large numbers of people. The perimeter-to-area difference between classic parks and greenbelts means they have  different effects on development, at least within the confines of the paper’s model. Where classic parks spread development by acting as a second downtown, greenbelts that bound a city can hem it in. By diffusing a park’s benefits around the city rather than concentrating it in one place, greenbelts’ recreational values are typically lower than a classic park but accessible to more people. People want to live close to both open space and their jobs, so a properly configured greenbelt can boost neighborhood density between itself and downtown, limiting sprawl.

For greenbelts to be truly effective, the paper’s authors note, they must be sufficiently wide to discourage casual commuters from living outside its bounds. This is likely why greenbelts around cities like London and San Francisco have failed—they just weren’t big enough. Furthermore, while greenbelts can keep development inwardly focused, new parks within city limits can spur redevelopment of underpopulated areas. Together, they could be a powerful double whammy against sprawl.

Whatever the case, it’s clear that cities’ open-space strategies need to be well though out. Poorly planned park systems can have consequences that are not just unintended, but counterproductive.

Source:

Wu, J. (2003). The influence of public open space on urban spatial structure Journal of Environmental Economics and Management, 46 (2), 288-309 DOI: 10.1016/S0095-0696(03)00023-8

Photo by Troy Holden.

It’s not the yard that matters, it’s the view

Small yards

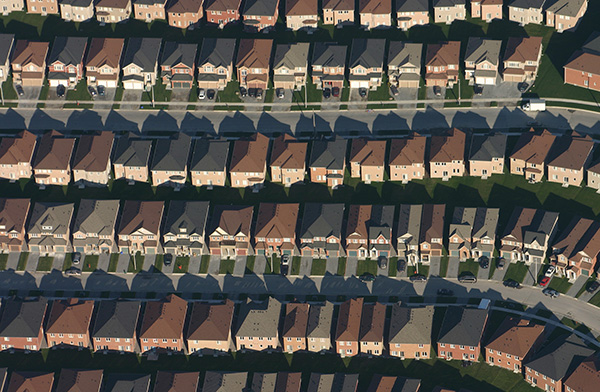
Americans love their privacy. Most aren’t keen on high rises or even attached condos, having been imprinted with a very specific American dream—that of a single-family house on a quarter acre lot. I’m one of them. But as populations in cities and suburbs boom, there’s simply less land to go around. The result of cramming detached homes into smaller spaces is often comical. With McMansions and McMansion, Jrs. shoulder-to-shoulder, the lots they sit on look like last year’s outfit on a six-foot sophomore.

Yet despite the potential aesthetic faux pas, many people want a single-family house. A lone house—never mind the neighbors six feet to the left and right—engenders feelings of independence and privacy. It’s self-sufficiency framed in two-by-fours. This is what planners and developers are up against as they struggle to fit more homes onto less land.

Such tight spacing of big houses has always been a bit of a mystery to me. The yards behind sardine houses are clearly more decorative than functional, so what’s the point of them? Wouldn’t everyone be happier if they lumped their token yards together? The resultant space would be magnitudes larger and more usable. But privacy would suffer. Or would it?

Maybe not. Homeowners feel just as happy and secluded in a single-family house as in a townhouse, so long as they have good views out their windows, according to one survey. The study asked homeowners in two neighboring developments—one with single-family houses and the other with townhouses—how they felt about their homes, their privacy, and their access to open space. Most people were happy, but the most satisfied were those whose views didn’t look directly onto the neighbors.

The differences between townhouse owners with views and without views were the most revealing. People with an open view were more likely to say they had enough space and privacy. Naturally, those with good views were also pleased with the way the subdivision was laid out, a trend which was echoed by owners of the detached single-family houses. The happiest people were those with homes that opened out onto undeveloped land like a flood plain or communal open space.

Given American’s penchant for privacy, I was surprised that owners of townhouses were more satisfied than owners of detached homes. The townhouses’ compact footprints may have given them an advantage. With 12.5 units per acre, the townhouse development was 2.5 times denser than the site with single-family houses. With the remaining space, the developers set aside 3.25 acres of open space. Though their motives for doing so weren’t clear—ordinances may have demanded it—it certainly had a positive effect on the way people viewed their own homes.

The market wasn’t as kind to the townhouses, however. Owners reported difficulty selling them while single-family houses in the neighboring development were selling like hotcakes. (This was during the mid-1990s.) So although people appear to be happy with attached housing once they’ve experienced it, most people crave the perceived privacy of single-family houses. Still if you’re looking for a home, it’s important to keep in mind that a grassy buffer may not be the path to happiness. What we see out our windows may have a larger effect on our sense of space and our happiness.

Source:

Day, L. (2000). Choosing a House: The Relationship between Dwelling Type, Perception of Privacy and Residential Satisfaction Journal of Planning Education and Research, 19 (3), 265-275 DOI: 10.1177/0739456X0001900305

Photo by IDuke.

Related post:

The roadless neighborhoods of Radburn, New Jersey

Plants rockin’ the suburbs, animals not so much

tufted hair grass (Deschampsia caespitosa) in a yard

Where there are more people, there’s less nature. It’s a fairly well established fact. Manhattan may have the odd hawk or falcon, but the paved island’s diversity of plants and animals just can’t compare to that of 23 square miles of pristine wilderness. What’s less known is how well biodiversity fares in human landscapes that are somewhere between the Empire State Building and Daniel Boone’s back forty.

Many scientific papers have been written about how specific types of plants and animals fare in the countryside, the city, and places in between, but few summarize the big picture. One review paper did take a wider view and surveyed 105 studies. It found that though most types of animals avoid the city, plant life seems perfectly happy living the suburban dream.

Animals, specifically mammals, reptiles, and amphibians,¹ dropped precipitously in most studies as researchers moved from the countryside to the city. In the first transition—from the countryside to the suburbs—only three studies found the same or greater numbers of mammal, reptile, and amphibian species, while 14 studies reported fewer. Invertebrate diversity rose in 14 studies, but fell in 30 others and remained the same in only three reports. These negative trends were magnified in the transition between the suburbs and the city proper. All but one study reported the same or fewer numbers of species of invertebrates in the big city as in the suburbs. As the researchers moved into the city and human population density increased, they found fewer mammal, reptile, and amphibian species.

Loss of habitat is probably behind this steady decline. Larger animals like mammals, reptiles, and amphibians need relatively large plots of land to survive. Invertebrates like insects are better off in human-dominated areas because of their smaller size—even a single tree can support dozens of different insects.

Amidst the gloom, plants were the one bright spot. In the suburb-city transition, plant diversity advanced in seven studies and retreated in seven others. It thrived when moving from the countryside to the suburbs. Plants’ success is probably due to their negligible requirements. Many only require a bit of soil, some water, and moderately clean air. On top of that, people often lend plants a helping hand by planting, watering, and fertilizing them. And while a home may have a cat and a dog, many sport dozens of different flowers, trees, and shrubs in their garden. Suburban lots are both large enough to encourage gardens yet small enough for people to support more diversity than on sprawling country lots. Even different landscaping preferences between different households fosters higher diversity.

Suburban plant diversity, though, probably comes at the expense of native flora. Most yards are beautified with species exotic to the area. Many are chosen simply based on their appearance or low maintenance. Native gardens are becoming more popular, but their numbers still pale in comparison to more traditional yards. It’s my suspicion that non-native landscaping holds down the diversity of mammals, reptiles, amphibians, and invertebrates. Native plantings would probably aid native animals, helping to offset some of the land taken by development.


  1. This review did not include birds—there are so many studies of birds in cities that it would be another paper in and of itself.

McKinney, M. (2008). Effects of urbanization on species richness: A review of plants and animals Urban Ecosystems, 11 (2), 161-176 DOI: 10.1007/s11252-007-0045-4

Photo by pluckytree.

Related post:

City birds smarter than you might think

Do people follow trains, or do trains follow people? London’s Underground solves a riddle

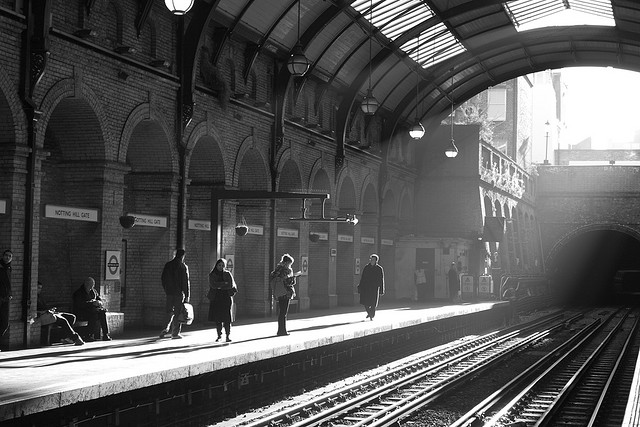
Notting Hill Station, London Underground

Transit oriented development is all the rage in urban planning these days. Proponents claim new transit coupled with mixed-use zoning will ignite growth in otherwise struggling areas. Detractors claim running new lines to low-density neighborhoods will leave cities burdened with white elephants. Overall, reality is probably somewhere in between, but transit and population density is a real chicken-or-the-egg problem. Which comes first?

This post was chosen as an Editor's Selection for ResearchBlogging.org

Greater London is perhaps the perfect region to explore this question. Home to the world’s first metro system, London was also one of the first cities to explore transit oriented development. The Metropolitan Railway (the Underground’s former name) had the authority to coordinate rail lines with housing development, which it leveraged to the tune of 15,000 houses on 2,200 acres. It also built lines to serve neighborhoods already teeming with people.

But the Metropolitan Railway did not have a monopoly on rail transport between London and the suburbs. Other companies both served existing towns and built new lines to otherwise underpopulated regions. Some teamed up with developers in the hopes of ensuring a steady stream of riders. Others lines were purely speculative, with owners hoping that development would follow.

Fortunately for the Metropolitan Railway and other companies, the majority of speculative rail lines were successful in spurring growth, according to a 2007 research paper. The study examined two hypotheses: One, that transit oriented development works, and two, that transit follows population density. Both proved to be true. The paper’s author found that population density was driven by the presence of train stations, and that the presence of train stations could be explained by population density. For each one percent increase in rail capacity, population density increased nearly a quarter of a percent. And each one percent increase in population density over ten years leads to about a one quarter percent increase in train station density. “Train service led to a suburbanization of countryside and increased population of new developments, which attracted more railways,” he wrote.

Mass transit, at least in the case of rail, appears to both drive development and benefit from it. Furthermore, the study claims, the Underground has helped build London’s city center into the commercial powerhouse it is today by fostering commuting from the city’s periphery. With more people commuting from the suburbs, commercial space could expand within the city center. And as people moved out of the city center, the sorts of traffic the Underground carried began to change too, adding more business-to-business traffic than before. The shifting uses of the London Underground can also inform future transit planning. Building systems to merely serve existing commuting traffic will likely result in an overburdened system.

Source:

Levinson, D. (2007). Density and dispersion: the co-development of land use and rail in London Journal of Economic Geography, 8 (1), 55-77 DOI: 10.1093/jeg/lbm038

Photo by drewleavy.

Related posts:

Paying for proximity: The value of houses near train stations

Proximity sans convenience: Houses near train tracks and freeways

Can we feed the world and save its forests?

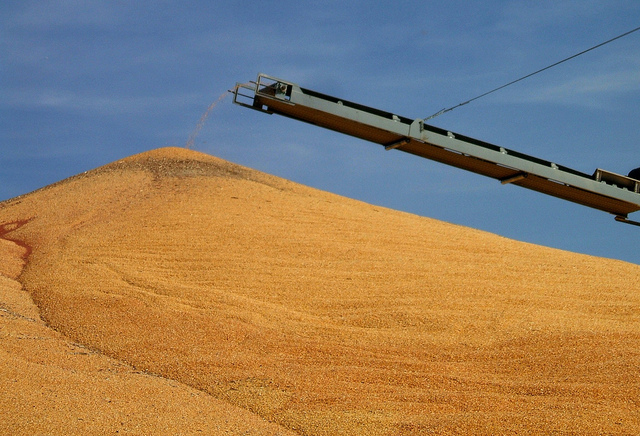
corn pile

Nine billion is the number that will define the 21st century. That’s the number of people expected to live on this planet by 2045. But 9 billion mouths are a lot to feed, and each of them will hopefully have more than enough to eat. Achieving both goals—feeding 9 billion and feeding them properly—will be a herculean task. It’s also one that could eliminate the world’s great remaining forests, taking with them ecosystem services like carbon storage, reliable rainfall, biodiversity, and the magnificence of miles upon miles of wilderness.

So what if someone said it might be possible to ramp up food production while expanding forested land? Sounds like a perpetual motion machine, right? It smacks of the impossible. But that’s just what Eric Lambin and Patrick Meyfroidt are proposing in their paper which appears in the Proceedings of the National Academy of Science. They think that boosting agricultural intensity can not only increase agricultural output, but also reverse deforestation. In theory, doing more with less is a great way to solve the world’s problems, but these theories usually come with a catch. And Lambin and Meyfroidt’s catch is a big one—the radical globalization of the world’s food markets. It’s an intriguing proposal with some hard data to back it up, but the authors are also quick to brush aside the potential problems.

Globalization, Lambin and Meyfroidt claim, can focus farming where it is most productive. In their vision, different regions will specialize in different crops, eking the most out of every acre of cultivated land. Those crops will then be whisked across borders to where they are needed. It’s the exact opposite of every locally-harvested, free-range, organically-grown mantra that’s proposed to save the world.

The authors outline four facets of globalization that could help or harm the cause. The first, displacement, could go either way. Displacement essentially moves crop production and timber harvesting from one place to another. As rich nations seek to protect their forests, for example, they must import their timber from elsewhere. The same goes with food stuffs. In Switzerland, for instance, the land required to grow its imported food is one and a half times more than the country’s currently cultivated land. But displacement may not be all bad, they say. For every 20 hectares of forest protected in North America and Europe, for example, only about one hectare of primary forest is logged in Russia or the tropics.

The second proviso they cite is rebound. As a new technology becomes cheaper, demand for it will increase as it becomes cost effective for more industries. Cheap gasoline, for example, has led to a proliferation of gas-powered devices (think leaf blowers, lawn mowers, and so on). More efficient agriculture, Lambin and Meyfroidt state, could also be more lucrative agriculture, driving an expansion of cropland rather than a reduction. They point to soybeans in Brazil and oil palm in Indonesia and Malaysia as examples. But they also counter that agricultural intensification since 1961 has reduced the amount of land that otherwise would have been needed to feed the world’s people.

The third caveat of globalization is cascade effects, whereby one crop displaces another, exploiting previously uncultivated land. Biofuels are a case in point. As some farmers use their land to cash in on the craze, other land is put under the plow to produce food stuffs.

Remittances are the last side-effect of globalization, and one that seems to be a net positive. Foreign workers often send money back to family members still in their home country, and the added influx of cash reduces the need for farmland in that country. With supplemented incomes, people can afford to purchase more food as opposed to growing all of it. Since subsistence farming is not very intensive, people’s remittance-assisted diets rely on less land.

Lambin and Meyfroidt offer four examples of countries in which agricultural output has risen concomitant with population and the amount of forested land—China, Costa Rica, El Salvador, and Brazil. Each case appears to be fairly unique, though, and is not enough to convince me that globalization and intensification are the best solution. China, for example, has turned to Africa to help feed its 1.3 billion people, locking up over 28,000 square miles of farmland and counting. Costa Rica’s success has been dependent on foreign groups purchasing land for conservation (a sort of highfalutin remittance), while El Salvador relies on small-scale remittances. Furthermore, statistics on Vietnam’s and China’s forests have both benefitted from plantations, which some experts have called “ecological deserts” and poor substitutes for the real thing. Furthermore, Lambin and Meyfroidt admit that many other countries in similar circumstances have not seen an uptick in the amount of forested land.

The authors also gloss over a major pitfall of globalization—pollution. Currently, shipping releases 1.12 billion metric tons of CO₂ per year into the atmosphere, or more than Germany, the world’s sixth largest emitter. Transporting food all around the world will only drive that number up. With climate change threatening to upend farming as we know it, pumping more CO₂ into the atmosphere may not be the best idea. That’s not to say the proposal is worthless—nine billion people are an awful lot to feed, after all—but there are some big questions that need to be answered before it should be seriously considered.

Source:

Lambin, E., & Meyfroidt, P. (2011). Inaugural Article: Global land use change, economic globalization, and the looming land scarcity Proceedings of the National Academy of Sciences DOI: 10.1073/pnas.1100480108

Photo by ConanTheLibrarian.

Related posts:

Small farms in modern times

The slings and arrows of geography and clean water

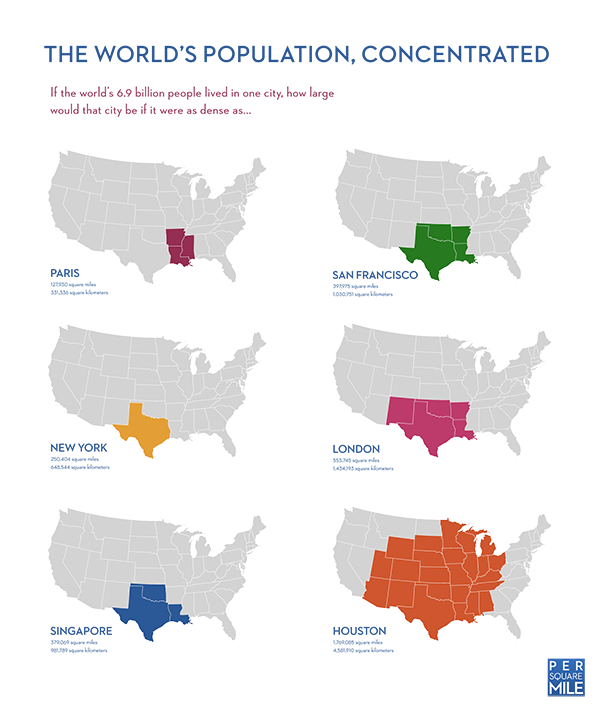
If the world’s population lived in one city…

The woods that were

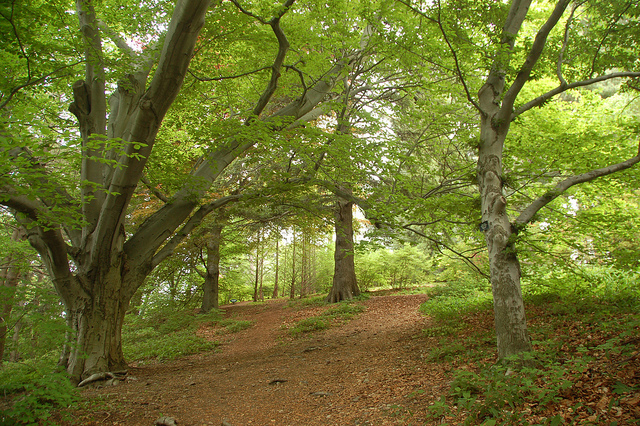
forest with open understory

Half a block from my childhood home is a park where I spent countless hours. But it isn’t your ordinary city park. Within the confines of its unusually large 14 acres lie three distinct forests, each a snapshot of a period in time for America’s eastern hardwood forests. At the time, the smallest was a dense and brambly thicket. It reminded me of a field gone fallow, a farmer’s broken dream. The largest was a maze of young trees and even younger saplings, the sort that lines the backyards of new suburban homes. The one in between—the one that’s just right—was filled with colossal sugar maples and stately oaks. It wasn’t burdened with an impassable understory like the other two, letting me, my sister, and my friends roam freely beneath its towering canopy. It’s exactly what I imagined Wisconsin was like before going under the plow.

This post was chosen as an Editor's Selection for ResearchBlogging.orgIt turns out my romanticized vision of the the great American hardwood forests was not too far from the truth. Upon first observing the American landscape from the Potomac River, Andrew White, a Jesuit priest and one of the founders of Maryland, wrote that “Fine groves of trees did appear, not choked with briers or bushes and undergrowth, but growing at intervals as if planted by the hand of man, so that you can drive a four-horse carriage, wherever you choose, through the midst of the trees.”

Clearly, the forests of the eastern United States were nothing like the thickets I avoided during my youth, or the brambles that bound backyards and border highway road cuts. The reason for this is simple—pre-settlement forests were working landscapes, set afire at regular intervals to clear out the old underbrush.

Colonist Thomas Morton reported in 1637 that the American Indians “were accustomed to set fire to the Country in all places where they come…The reason that mooves them to doe so, is because it would other wise be so overgrowne with underweedes that it would be all a coppice wood, and the people would not be able in any wise to passe through the Country out of a beaten path.”

Movement was but one reason American Indians set fire to the forests; perhaps more importantly, fire sweetened forage for game animals like deer and was a powerful tool to clear land for agriculture. They lit fires every seven to ten years to clear out the old underbrush for better hunting and larger fires every 15 to 30 years for planting. The higher frequency fires were low intensity, allowing mature saplings to survive, while the larger fires consumed every tree, leaving the land open for planting. After a while, farming sapped the fertility from the large openings. Villages would then move on to clear new fields, leaving the old ones to be reforested. As a result, the early American landscape was a patchwork of forest and plain, new growth and old.

European settlers initially used fire as well, but merely as a tool to clear the land for agriculture. As the nation’s population increased over the years, using fire fell out of favor. Eventually, fire was exiled from the American forest.

The resulting absence of fire has sharply increased tree densities in the remaining forests. Without fire to clear out a few generations of young seedlings and saplings, more trees survive to adulthood, clogging the landscape. One study in Michigan’s Upper Peninsula reports that tree densities have doubled, if not tripled, since the mid-1800s. At the same time, the size of the individual trees has declined. Younger trees have sprung up unchecked, creating the sometimes messy looking forests you see today.

That’s not to say these denser, thicker forests are bad with a capital B. It all comes down to the type of landscape in which we wish to live. The parklike landscapes of early America caught the eye of many a colonist, and probably not just because it reminded them of the old country. Some research suggests that humans may have an innate affinity for open woodlands that harbor clear sight lines. And there are many ecological benefits to creating a wooded landscape varied in both density and age. Without fire, clearing out underbrush to recreate the forests of yore is a difficult task. But if you’re a landowner interested in curating a slice of history, perhaps it’s one worth considering. Just consult your local ecologist before firing up the chainsaw.

Sources:

Moreton, Thomas. The New English Canaan. The Prince Society, Boston. 1883. (available online)

Williams, Michael. Americans and their forests: A historical geography. Cambridge University Press, Cambridge. 1989.

White, Andrew. Relatio itineris in Marylandiam: declaratio coloniae domini baronis de Baltimoro. Excerpta ex diversis litteris missionariorum ab anno 1635, ad annum 1638. Narrative of a voyage to Maryland. Maryland Historical Society, Baltimore. 1874. (available online)

Zhang, Q., Pregitzer, K., & Reed, D. (2000). Historical Changes in the Forests of the Luce District of the Upper Peninsula of Michigan The American Midland Naturalist, 143 (1), 94-110 DOI: 10.1674/0003-0031(2000)143[0094:HCITFO]2.0.CO;2

Photo by Chris Devers.

Related post:

Density in the pre-Columbian United States: A look at Cahokia

Density in the pre-Columbian United States: A look at Cahokia

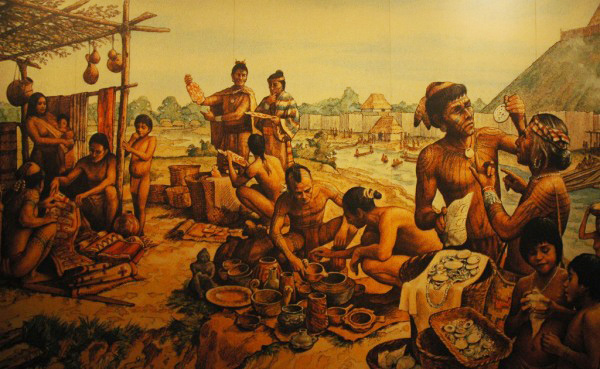
Cahokia mural

Cahokia is one of the largest historical American cities you’ve probably never heard of. Peaking around 1250 CE, Cahokia is considered the first Mississipian settlement, a culture which spread to throughout the central and southeastern United States. The city’s inhabitants built over 100 mounds, eighty of which remain. One of them still towers 92 feet over the surrounding fields and is easily visible from the scratched postage-stamp windows of St. Louis’ Gateway Arch. With somewhere between 10,000 to 15,000 people, it held the record for the largest American city until around 1800, when Philadelphia finally overtook it.

With that many people crammed into just under three-quarters of a square mile—the estimated size of the city’s neighborhoods—it may sound like Cahokia was as cramped as the slums of Upton Sinclair’s Chicago. But it probably didn’t feel that way. Sweeping plazas and towering mounds added nearly three square miles of open space, keeping much of the city open and airy like Baron Haussmann’s Paris. Yet unlike the city on the Seine’s astronomical modern density of 58,890 people per square mile, Cahokia’s population lived at a positively suburban 1,000 to 1,500 people per square mile, thanks to the plazas and mounds.

Archaeological excavations in the area suggest that Cahokia proper can be bounded by one circle two miles in diameter and another about 1,200 yards in diameter. Of that space, less than 20 percent was devoted to housing, which was clustered in small groups. The rest of the area was tied up in grand plazas and towering earth mounds. So while the density was higher in the housing clusters—about 5,600 to 8,500 people per square mile—open space was never far away. Cahokia may have been bustling for the time, but it was probably a pleasant place to live.

Flipping through the pages of a book chapter on Cahokia’s population, I was struck by the way archaeologists used population density not as a final product, but a building block. By excavating only small areas—sampling the landscape, in effect—they estimate both the number of people that occupied a certain area (based on the size and number of houses) and the extent of housing within the settlement. They then multiply the two together and get a reliable estimate of its population. Modern population density is derived the other way around, built from census data and community extents.

Source:

Pauketat, Timothy R., & Lopinot, Neal H. (1997). Cahokian Population Dynamics Cahokia: Domination and Ideology in the Mississippian World, 103-123 Other: 978-0803237087 University of Nebraska Press, Lincoln, Nebraska.

Photo of interpretive center mural by emilydickinsonridesabmx.

Related post:

The woods that were

The slings and arrows of geography and clean water

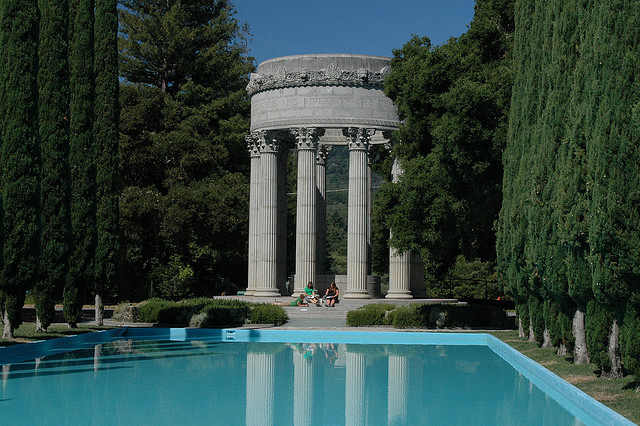
Pulgas Water Temple

The things people want and need are often far away from where they live. It’s a bit of geographic inequality that applies to all of us. The U.S. trade deficit with China is one example of the problem. Another is ecosystem services.

Ecosystem services range from clean water to fresh air to crop pollination and many more. Even the big tree shading your house or apartment building is providing an ecosystem service. The list is so long that most scientific studies suffice with a subset. Healthy ecosystems provide them at no cost to us, but if we were forced to replicate the services ourselves, it would cost us at least $24 trillion annually.¹ Global gross domestic product in 2009 was $58 trillion. In other words, we’d have to commit nearly half of the global economy to replicating ecosystem services if they were lost. In other, other words, we can’t afford to lose them.

The real wrinkle with ecosystem services is that many are most needed where they are most difficult to preserve—in dense urban areas. That’s what a 2009 study investigating the geographic disparity between supply and demand of ecosystem services found. The study’s author built a model to determine which lands would be most economical to purchase to provide a given service. He based the model on bid-rent theory, which describes how much money people are willing to pay for property close to downtown. The closer to downtown, the higher the rents. The model also takes into account the ease with which each ecosystem service can be “transported,” or the distance at which the ecosystem service remains beneficial. Using these two costs, the author attempts to find the sweet spot where governments and conservation groups can get the most bang for their buck.

What he found was that the most desirable land and the distance at which it is effective depends on the service in question. For something like clean drinking water, for example, the best land may not be the closest. Take San Francisco’s water supply, which comes from the Hetch Hetchy watershed. Hetch Hetchy is hundreds of miles from the city, but aqueducts allow the benefit of the ecosystem service to be transported to San Franciscans’ taps.²

Parkland, on the other hand, is not as readily transportable. For people to enjoy a park, it needs to be within a reasonable distance from their homes. The study found that the best parks—those that have the highest recreational value in the model—were those closest to the city center. Recreational value diminishes with distance from the city center, out to about 5.4 miles (10 km) from downtown. After that, one park is just about as much fun as any other.

The sweet spots are those that can protect two, three, or more ecosystem services. For example, a forest set aside as a regional park on the outskirts of a city can provide clean drinking water, reduce runoff to mitigate flooding, store carbon, and preserve biodiversity. This is, however, a best case scenario. The authors of a 2006 paper reports that, in their study area, only a select few patches of land could support four or more ecosystem services.

Governments and organizations looking to protect ecosystem services must spend their money wisely, allocating it where the most people will derive the most benefit for the least amount of money. Where those paths cross may not be obvious, though.³ Ultimately, the answer will come down to the value we place on each ecosystem service.


  1. Based on the results of Costanza et al. and adjusted for inflation to 2009 dollars.
  2. That’s not to say the flooding of Hetch Hetchy is a net benefit for ecosystem services overall—merely that the fresh water service can be provided from hundreds of miles away.
  3. By way of example, San Francisco set aside $150 million in 2000 to purchase parkland within the city, even though there was only an estimated 355 acres (144 ha) of undeveloped available. By contrast, Sonoma County, just to the northeast of San Francisco, has spent $200 million to protect nearly 70,000 acres (28,300 ha). Does that mean San Francisco is wasting its money? Not necessarily. By adding parkland within city limits, where 17,323 people live per square mile, each acre is benefitting far more people than an acre in Sonoma County, where only 290 people live per square mile.

Sources:

McDonald, Robert I. (2009). Ecosystem service demand and supply along the urban-to-rural gradient Journal of Conservation Planning, 5, 1-14. (available online)

Chan, K., Shaw, M., Cameron, D., Underwood, E., & Daily, G. (2006). Conservation Planning for Ecosystem Services PLoS Biology, 4 (11) DOI: 10.1371/journal.pbio.0040379

Costanza, R., d’Arge, R., de Groot, R., Farber, S., Grasso, M., Hannon, B., Limburg, K., Naeem, S., O’Neill, R., Paruelo, J., Raskin, R., Sutton, P., & van den Belt, M. (1997). The value of the world’s ecosystem services and natural capital Nature, 387 (6630), 253-260 DOI: 10.1038/387253a0

Photo by km6xo.

About the image: The Pulgas Water Temple was built in the 1930s at the terminus of the Hetch Hetchy aqueduct. Before 2004, water from the aqueduct flowed through the temple before traveling on toward San Francisco.

Munich: The Million Person Town

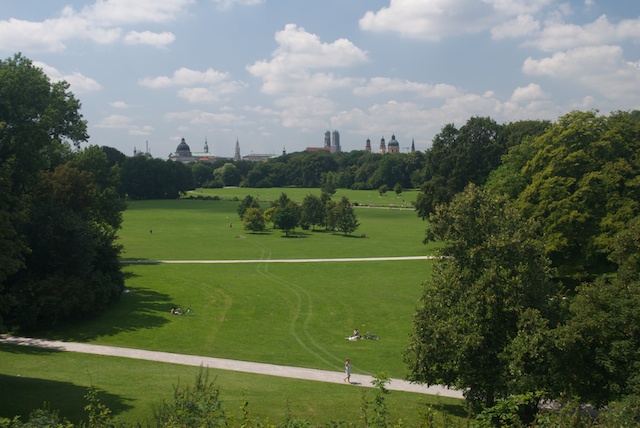
Englisher Garten, Munich

Millionendorf. The Million Person Town, as Müncheners happily call their city. It’s an apt description—Munich is as skilled at masking it’s size as Mexican druglords are at hiding their contraband. The place literally feels smaller than it is, thanks in part to it’s compact footprint. Munich’s sights are easily accessible without a car, and the idyllic German countryside is a short trip out of town. How did the Munich area avoid sprawl while its population boomed? Planning, in a word. Munich and its neighbors have been at it for 60 years.

Munich, by rights and means, should be a car town. Six Autobahnen feed car and truck traffic into the city’s heart, BMW’s world headquarters lie within the city limits, and it has the highest per capita income of all the major German cities. But despite its predisposition to automobiliphilia, Munich is one of the few major European cities which had its population grow more rapidly than its boundaries.

It all boils down to a few decisions Munich made when it rebuilt after World War II. With the city mostly bombed out, planners decided to restore the historical center to its pre-war appearance and layout, forgoing a car friendly grid. In the process, they hemmed in the old town with a ring road to deal with traffic. But the old Munich and the new ring road wouldn’t suffice for long. Just over a decade after the end of the war, the city’s population surged past one million as people flocked to the city from the countryside in search of jobs. Those jobs paid well, and rising affluence led to wider adoption of automobiles. Both of these trends often test the demands of traditional city planning. In most cases, city planners would have done what was easiest—expand.

Instead, Munich city planners took advantage of the newly passed Bundesbaugesetz (federal construction law) to form a city planning commission that oversaw not just urban development, but also economic, social, educational, and cultural interests. By 1963, they produced their first plan and a few years later formed an department tasked with coordinating planning activities and reaching out to research, business, industrial, and residential communities.

Though the plan saw few updates in subsequent decades, its 1988 revival renewed interest in keeping Munich’s footprint small. The relative paucity of sprawl in the Munich area is due in part to city’s desire to maintain its density. The city has encouraged redevelopment of its brownfields: As industries have vacated factories and military installations been abandoned, economic incentives helped fill the gaps with housing, business parks, and industrial parks. Munich’s well-oiled and thoroughly modern mass transit system has also kept residents moving efficiently despite the density. Plus, it’s a treat to ride—trains run frequently, the stations are clean, and the latest interiors of the latest trains benefit from stunning design. Finally, the city has placed an emphasis on open space. Parks like the Englisher Garten (pictured above) line the Isar River in the city, and substantial forest reserves surrounding the city have kept a lid on expansion.

Regional planning in Munich has been less codified, but similarly effective. Most municipalities in the metropolitan area have been a member of the regional planning association since the 1950s. Though participation is voluntary, the organization’s lengthy history has probably contributed to its success in orchestrating regional growth. While many similar metro areas in Germany and throughout Europe have expanded outwards, the Munich region has managed to direct much of its spatial growth to undeveloped enclaves.

Sources:

European Environment Agency. 2006. Urban sprawl in Europe: The ignored challenge. EAA Report No. 10/2006.

Wengert, Norman. 1975. Land use planning and control in the German Federal Republic. Natural Resources Journal 15:511-528. (available online)

Related posts:

Suburbia no more? Not quite yet

“What if” development ran rampant in Silicon Valley?

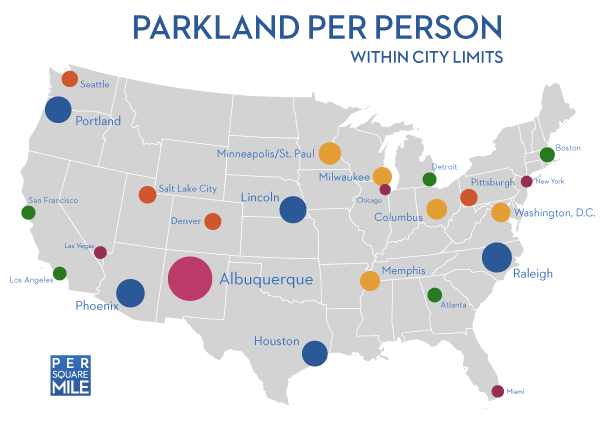
Parkland per person in the United States

Parkland per person in the U.S.

click for more detail

City parks are somewhat under appreciated commodities, I think. You don’t notice how much you use them until they’re gone. That was my experience when I moved to Berkeley, California, an environmentally progressive city that oddly lacks a large, centrally located park. As a result, the smaller parks were very manicured and much too small—and crowded—to ever feel like you were getting away from the hordes.

“But wait!” residents of Berkeley are surely saying to themselves. “What about the East Bay regional parks? Or the marina?” Spanning thousands of acres, the regional parks (and Berkeley Marina, to some extent) are civic treasures, filled with wilderness and open space. All that they lack is convenience. They are miles from where most people live and one thousand feet uphill. The regional parks almost require a car to access them—scant few bus lines run to them.

It impressed upon me the importance of not only having parks close at hand, but also having them be large enough to enjoy.

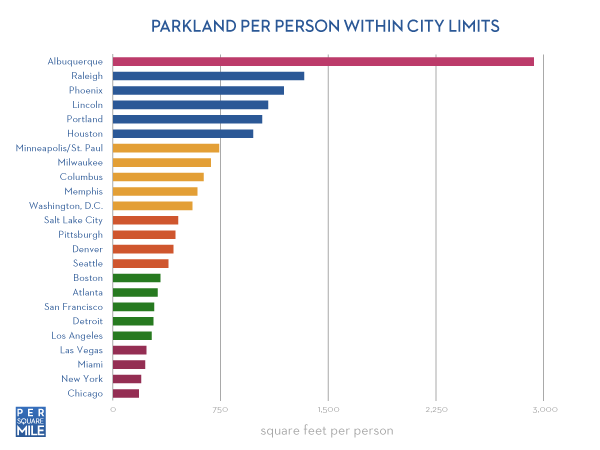
Parkland per person in the U.S. - graph

click for more detail

For reference, Berkeley has 102,822 residents and 230 acres of parkland within its city boundaries—including the marina. That equates to 97 square feet of parkland per person, well below Chicago, which has 182 square feet per person.

Related posts:

If the world’s population lived in one city…

The map that started it all

Suburbia no more? Not quite yet

Aerial view of a new subdivision

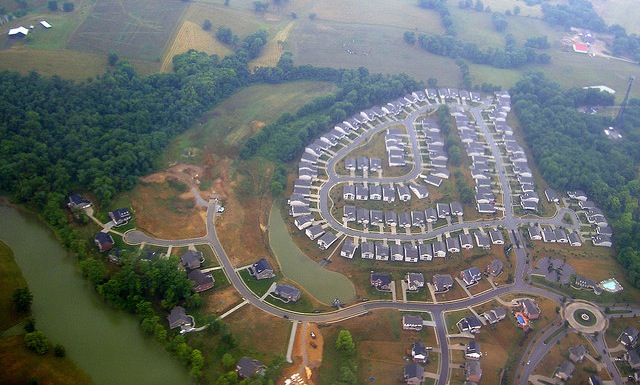
Travel just outside any large American city and one of the things you may notice is the number of new construction projects. Fresh, undeveloped land on the fringe of a metropolitan area is land ripe for the picking, every developers dream. The pace of suburban development, it would seem, has not slackened since it started in the 1950s. But things are not always what they seem. Though many major American cities are continuing to grow, each person they add is taking up less land than the person before them. From Houston to New York to Los Angeles, cities are consuming land at a slower rate than before.

The study that stumbled upon this nugget was originally looking for links between types of zoning laws and the amount of land consumed per additional person in a metropolitan area. They found that cities with ordinances that encouraged the redevelopment of old sites within city limits reduced their per capita land consumption by twice as much as cities with more traditional zoning laws. Overall, major metro areas in the U.S. added 1,184 square feet (110 square m) less land per person in 2000 than they had in 1990. Additionally, in cities that did slow their rate of per capita land consumption, more people settled in denser neighborhoods. The study shows that zoning laws do have an effect…sort of. It turns out that zoning laws are not entirely responsible for the change.

Part of the proof is the fact that four of the major Texas metropolitan areas grew and consumed less land per capita, too. If you’ve ever visited or flown over any of these cities—Houston, Dallas/Ft. Worth, Austin, San Antonio—you know they don’t keep a tight leash on development. I’ve visited or driven through each of them over the years, and I got the impression they were sitting atop massive suburban volcanoes, spewing strip mall magma and tract housing pyroclastics. Since Texas does not have many natural barriers to impede city growth, you’d think its cities would just keep growing. Except they haven’t.

The study’s authors don’t touch on possible reasons behind the Texas anomaly—there were too few metro areas that followed the zoning creed to make any statistical inferences—but I have hunch why their rate of per capita land consumption is dropping like a stone. Without trains to rapidly move people from place to place, the freeways and tollways have become saturated with traffic. Large, low-density cities simply take too long to traverse. People in Texas may be warming up to higher density living, but not after thousands of square miles have been gobbled up by Walmarts and Whataburgers.

The sprawling cities of the Southeast may want to take notice of what’s happening in Texas. Though many saw their per capita land consumption slow as well, their urban cores did not grow any denser, suggesting they may follow a very Texas-like trajectory. On the other side of the country, many Western cities, such as Phoenix, have already reached their saturation points and have begun to densify.

Still, not every city is building up instead of out. The Grand Forks, ND, metro area, for example, has been adding a whopping 1.3 acres (0.54 ha) per person, compared to the New York metro area, which has added only one tenth of an acre (0.05 ha) per person.

While inward-looking zoning laws have reduced the rate at which cities are expanding per person, they apparently have not had much of an impact on the proportion of people living in denser neighborhoods. What does seem to work are conservation programs. Funding for such initiatives seems to be a very strong indicator that a city is densifying. “Cities with any level of conservation funding are denser than cities with no conservation funding,” the authors report. Though they have no data to explain why this is, they do have a few reasonable guesses. It could be that the conservation money sets some land aside for parks. Or maybe people who live in cities that invest in conservation are willing to live in denser neighborhoods.

Overall, many of America’s cities are finally curbing their seemingly insatiable appetite for land, but many have a long way to go before they begin to look like New York or San Francisco. Most of the land within American cities is locked up in low density development, which houses a relatively small number of people. So long as the desire for such housing exists, cities will continue expand.

Source:

McDonald, Robert I., Richard T. T. Forman, and Peter Kareiva. 2010. Open Space Loss and Land Inequality in United States’ Cities, 1990–2000. PLoS ONE 5: e9509. DOI: 10.1371/ journal.pone.0009509

Photo by opacity.

800 million spaces and nowhere to park?

parking lot

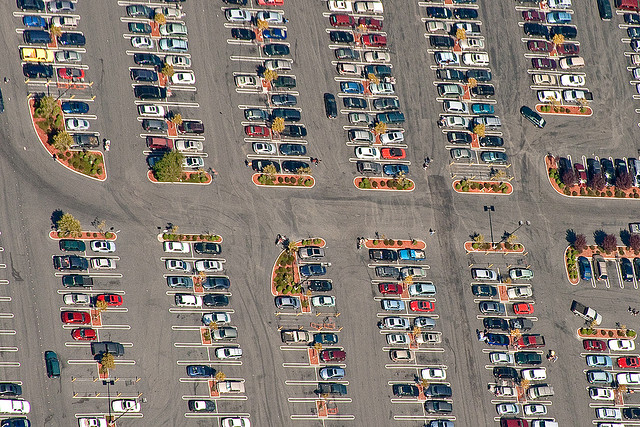
It’s sad but true. Americans likely have 800 million parking spaces at their disposal and many of us (myself included) have driven round and round the block looking for a spot. What gives? It’s the distribution, of course. Parking availability is heavily skewed to the places that seem to need it the least, like the suburbs. If you’re in a big city, that knowledge is a maddening fact of life. But there’s more to our surfeit of spots than simple frustration. Parking represents a large and often hidden cost of driving, and according to a study that estimated the number of spots, it adds to cars’ already substantial carbon footprints.

A team of engineers from UC Berkeley assembled a virtual dossier of parking spaces across the country. They drew on data from commercial parking companies, policy reports, government databases, surveys, and the urban planner’s old rule-of-thumb—eight parking spaces per car. The authors estimate the number of spots ranges from a low of 105 million (just those reported by an industry group) to a high of 2 billion (the rule-of-thumb estimate). The middle three estimates each fell around 800 million spaces, the number on which most media reports seem to have settled as the correct guess.¹

It’s likely then that the U.S. has over 500 million more parking spaces than registered vehicles. For every 100 square meters of roadway, there is about 50 square meters of parking space. In sum, the amount of land devoted roadways and parking in the U.S. can cover the entire state of West Virginia—that’s about 24,000 square miles or 62,000 square kilometers. If we use the study’s middle of the road estimates, a third of that number—about the size of New Jersey—is solely devoted to parking. Clearly, we have too much parking space in this country. The glut of free and cheap parking artificially lowers the cost of driving, encouraging people to stay in their cars, planners to pave more land, and politicians to look unfavorably on mass transit.

Even in dense urban areas, parking is woefully underpriced, according to Donald Shoup, the “prophet of parking.” Fortunately, many cities are starting to ratchet up prices. San Francisco has even gone so far as to pilot smart meters that adjust rates based on the availability of spaces as measured by in-road wireless sensors. The goal is to leave 15 percent of spaces free at all times, a number Shoup’s research says minimizes the amount of time people hunt for parking spaces and thus reduces greenhouse gas emissions.

Smarter use of parking spaces is not the only way to limit their environmental impact. Reducing the number would also create some some drastic results. The energy and resources that go into paving for parking increases carbon emissions by 62 percent for sedans and SUVs and 67 percent for pickup trucks. Plus, associated emissions of soot and volatile organic compounds are also substantially higher, offsetting some of the benefits of catalytic converters on cars and trucks. Less land paved by asphalt would also reduce the urban heat island effect, which in turn would lessen the strain on buildings’ air conditioning systems.

The inventory’s cataloged environmental impacts, though extensive, are only part of the story. For example, the study does not calculate the additional amount of roadway and other infrastructure that is required to accommodate massive parking lots and wider streets. Many communities require wide roadways for street parking despite the fact that nearly all of their houses and apartment buildings have off-street parking. The reduction in paved areas would be substantial if these communities would build narrower roads and restrict parking to one side. City footprints would also shrink. Even in existing neighborhoods, road rebuilding projects could pare down street widths and widen parkways.² Though the amount of added greenery would seem small, a 30 percent reduction in impervious roadway surfaces would ease the strain on sewer and water treatment systems and help mitigate flooding.

To think, our cities could be radically different if we’d just reconsider the number of parking spaces we really need.


  1. Many articles on the study report the authors claim 800 million is the most likely estimate, but I couldn’t find confirmation of that anywhere in the article. Still, 2 billion seems unreasonably high, and 105 million improbably low, so 800 million is a good guess.
  2. Also known as tree lawns, sidewalk buffers, devil strips, city grass, and so on. If you need a picture, here you go.

Source:

Chester, M., Horvath, A., & Madanat, S. (2010). Parking infrastructure: energy, emissions, and automobile life-cycle environmental accounting Environmental Research Letters, 5 (3) DOI: 10.1088/1748-9326/5/3/034001

Photo by Troy Holden.