7 billion

Earth

Sometime today—or maybe it’s already happened—the 7 billionth person on this planet will be born. It’s a milestone, that’s for certain, though I’m unsure whether it’s auspicious or portentous. What I do know is it’s a bit contrived. The 7 billionth person will face the same challenges as the baby born just before or just after. They are all entering a world that is trying to answer its most pressing question—how many of us can it support?

The answer depends, of course, on what sort of future those people will have. Will they live like Americans—sated and safe—or like Somalians—as uncertain about their next meal as they are about their country’s fate? That, of course, depends on resources. In truth, we won’t know the answers to any of these questions until we get there, if we’re even lucky enough to realize when we’ve arrived.

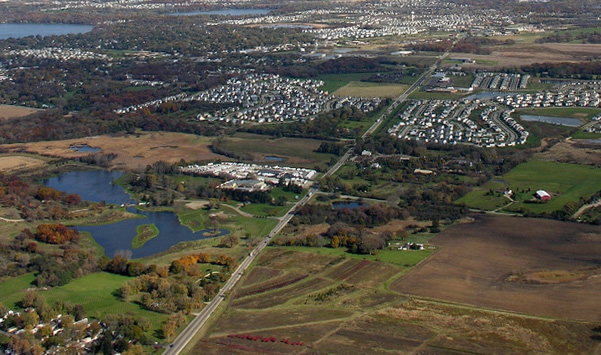
For years now, I’ve felt as though the world has been filling up around me. Part of that has been the result of changing scenery, an impression reinforced by years of moving up the density ladder from small towns to bigger cities. But that feeling is also supported by cold, hard facts. My worlds are filling up. It’s most evident in my hometown, a small city where change comes slowly if at all. Yet even there, the roads and houses and shops I knew can’t contain the now pulsing masses, grown half again as large as when I first knew them. Like a teenager, the city is coping with its new size awkwardly. Ambivalent about the future, it keeps trying to be the city I knew. But even I—with my propensity for nostalgia—know better. Every time I return, as I sit trapped a dozen deep at a stoplight, a lesson is writ large in the taillights of the car in front of me. Growth, like progress, cannot be stopped.

So as we cross this synthetic threshold, close your eyes for a second to take snapshot of the world as it is. It will never be the same. Then open them to a future that’s two people fuller.

Related posts:

If the world’s population lived in one city

Ghosts of geography

Density solidified early human domination

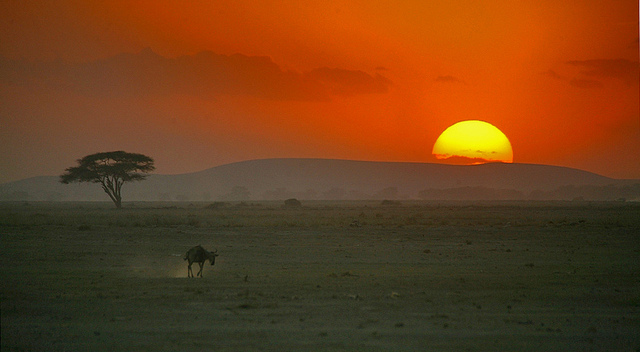
Sunset over the Kenyan savanna

It’s no surprise that Homo sapiens dominates the Earth. After all, we’re resourceful, social, and smart. No, the surprise is how we did so in just 50,000 years. Such a pace is unprecedented, especially for a long living, slow reproducing species such as ours. Intelligence and opposable thumbs certainly helped, but we aren’t the only ones who can use a tool or solve a puzzle. Rather, a peculiarity of our social nature may be what has set us apart, allowing us to live in nearly every biome on Earth.

The exact mechanics of how sociality fostered our dominance are fuzzy. Myriad archaeologists and anthropologists work hard to resolve those uncertainties, but history is vast and their resources are comparatively small. There is another option, though, one that relies on mathematical machinations and close study of the characteristics of modern day hunter-gatherer groups. Using those methods, a group of anthropologists and biologists think they may have solved part of the migratory riddle. Our predisposition to living densely, they suppose, may have contributed to our stunning success beyond the savannas of Africa.

A sublinear relationship between population size and home range size—meaning that larger groups live at higher densities—imparts special advantages for species that can deal with the twin burdens of density, overshoot and social conflict. Overshoot describes a population that overwhelms its habitat, devouring all available food and otherwise making a mess of the place. Social conflict is as it sounds, where tight proximities provoke fights between individuals. Together, those snags can bring a once booming population to it’s knees.

But social animals are uniquely adapted to cope with those problems. For one, social behavior soothes tensions when they do rise. And when it comes to the necessities of life, density conveys a distinct advantage for social species—resources, chiefly food, become easier to find. Larger, denser populations squeeze more out of a plot of land than an individual could on his or her own.

Density itself wasn’t directly responsible for the first forays out of Africa. Those groups were were too small and dispersed to receive a substantial boost from density. They faced the worst the natural world had to offer, and many probably couldn’t hack it.

Where population density conferred its advantages was when subsequent waves of colonizers followed. Density allowed those people to thrive. They joined the initial groups, growing more populous and drawing more resources from the land. This made groups more stable both physically and socially—full bellies lead to happier and healthier people. As each group’s numbers grew larger, their social bonds grew stronger and their chances of regional extinction plummeted. In other words, once people worked together to establish themselves, they were likely there to stay.

It’s a heartwarming story the scientific paper tells in the unsentimental language of mathematics. It implies that the essential success of our species can be boiled down to one variable, β, and one value of that variable, ¾. The variable β is an exponent that describes how populations scale numerically and geographically. Its value of ¾ is significant. When β equals one or greater, each additional person requires the same amount of land or more—the group misses out on density’s advantages. But when β is less than one—as it is in our case—then a population becomes denser as it grows larger.

The degree of our sociality has allowed us to bend the curve of population density in our favor. If early humans had been an entirely selfish species—each individual requiring as much or more land than the previous—β would be equal to one or greater. We wouldn’t have lived at higher densities as our populations grew, and early forays beyond the savanna might have petered out. Instead of conquering the globe, we’d have been a footnote of evolution.¹

And here is where we can consider how this affects our modern lives. Population density may have aided our sojourn out of Africa, but it’s clear there are limits. Hunter-gatherer populations appear to be limited to around 1,000 people, depending on the carrying capacity of the ecosystem. Technology has raised carrying capacities beyond that number—as evinced by the last few millennia of human history—but we don’t know it’s limits. A scaling exponent equal to ¾ may have helped our rise to dominance, but it also could hasten our downfall. Technology may be able to smooth the path to beyond 7 billion, but what if it can’t? What if ¾ is an unbreakable rule? What happens if we reach a point where density can no longer save us from ourselves?

¹ I might point out here that β=¾ could tell us something about the viability of libertarianism, but that’s a subject for another post.

Source:

Hamilton, M., Burger, O., DeLong, J., Walker, R., Moses, M., & Brown, J. (2009). Population stability, cooperation, and the invasibility of the human species Proceedings of the National Academy of Sciences, 106 (30), 12255-12260 DOI: 10.1073/pnas.0905708106

Photo by lukasz dzierzanowski.

Related posts:

Floral metabolic densities

Hunter-gatherer populations show humans are hardwired for density

The curious relationship between place names and population density

What do population density, lightning, and the phone company have in common?

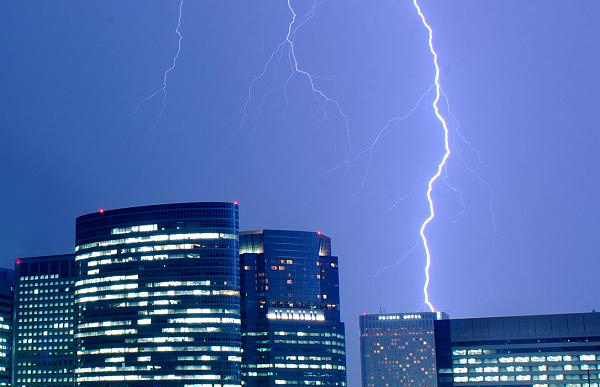
Lightning strike in Tokyo

File this one under “applications of population density”. Researchers working for Nippon Telephone and Telegraph—better known as NTT—discovered they could use an area’s population density to predict telecommunications equipment failure due to lighting strikes.

Telecommunications is an expensive business. Like other infrastructure, it requires a lot of manpower and capital to expand and maintain. But unlike many other systems, telecommunications—especially cellular network technology—has been advancing at a breakneck pace, requiring equipment to be upgraded or replaced every few years to stay current. Furthermore, the equipment is both delicate and expensive. Something like a lightning strike can easily cost tens to hundreds of thousands of dollars to repair.

The NTT researchers were interested in predicting where lightning strikes would exact the most damage in coming years, especially since some climate models predict more severe weather, which can lead to more lightning. The study focused on three prefectures in Japan—Tokyo, Saitama, and Gunma—which represent a gradient of population density ranging from one of the most built-up urban environments to relatively sparse farmland. The prefectures also fall along a gradient of lightning intensity, with Gunma at the high end receiving 10 strikes per square kilometer and Tokyo at the low end receiving 3 strikes per square kilometer.

Using past data on lightning strikes, telecom equipment failures due to lightning strikes, and the 2005 Japanese census, they developed a model to describe how telecom equipment failures due to lightning correlate with population density. At first blush, I expected urban areas to receive the brunt of the impact—after all, they have loads more equipment than rural areas—but the results were just the opposite. Expensive circuitry and antennas were safer in urban Tokyo than they were in rural Gunma, even when the discrepancy in lightning strikes between the two regions was taken into account.

The authors offer two explanations for why telecom equipment is safer in urban areas. First, many of the copper lines that feed base stations and boxes run underground in cities, which lowers the induced voltage during a strike. Second, the equipment itself tends to be exposed to the elements in the country, either on the ground or perched atop telephone poles. In the city, most of it in encased in apartment buildings.

But there is another possible explanation they missed—the design of telecom networks and their relationship to population density. The evidence lies in their calculated coefficient that describes  how population density can predict equipment failures due to lightning strikes. The coefficient is ¾, and if you’ve been reading this blog for a while, you’ll no doubt recognize that number. As an exponent, ¾ is powerful descriptor, explaining a variety of phenomenon ranging from how plant sizes influences population density to how human population density affects the density of place names.

In this case, ¾ seems to say less about the pattern of lightning strikes than it does about telecom network design and the differences between rural and urban infrastructure. Denser populations require more equipment, but not at a fixed rate. Cellular networks provide a good example. In rural areas, cell sizes are limited by area, not the number of users. It’s the opposite in the city—the more users, the smaller cells become. Therefore, phone companies can rely on fewer cells and less equipment per person in the city than in the country.

The relationship between infrastructure demands and population density could go a long way to explaining why there is a lower rate of equipment failure in denser areas—there’s simply less equipment per person in the city than in the country. But the fact that telecom infrastructure—and damage to it—appears to scale at the same power that describes an range of phenomena related to density and metabolism, well, that’s just too good to be a coincidence.

Sources:

X. Zhang, A. Sugiyama, & H. Kitabayashi (2011). Estimating telecommunication equipment failures due to lightning surges by using population density 2011 IEEE International Conference on Quality and Reliability (ICQR) , 182-185 : 10.1109/ICQR.2011.6031705

Photo by potarou.

Related posts:

Floral metabolic densities

Hunter-gatherer populations show humans are hardwired for density

The curious relationship between place names and population density

Floral metabolic densities

Cross-section of a rose pedicel, 10x magnification

Nature has a funny way of not behaving geometrically. When you plot all sorts of variables that describe the natural world—metabolism with body size, population size with home range, place names with population density—they don’t follow a linear relationship, they adhere to a power law. Plants, of course, are no exception. Plant population densities—like human population densities—follow a power law, where larger plants are dispersed ever farther apart.

The phenomenon was first described by Kyoji Yoda in a 1963 paper. For his Master’s thesis, he sampled weeds on vacant lots around Osaka, plotting their dry weight against the density at which they grew. He observed that as plant weight increased, density decreased by -³⁄₂. Competition for resources, he reasoned, caused the populations to thin. As plants grew larger, some died out for lack of resources. They just couldn’t compete against the others. Yoda’s self-thinning law is why the Earth isn’t entirely consumed by weeds—they may produce innumerable seeds, but not all make it to maturity. Yoda published his discovery in the Journal of Biology of the Osaka City University. It languished in obscurity for 15 years before other plant ecologists took notice.

The self-thinning rule is often called Yoda’s law, and it’s been empirically tested in ecosystems around the globe. It’s a pretty rad name for an ecological theory, which is why it’s a pity that it may not be entirely accurate. A more recent study suggests the theory describing plant population densities should hew closer to an exponent of -⁴⁄₃, not -³⁄₂. It’s a subtle distinction, but one that ultimately means plant densities are driven by their metabolisms. This revelation comes courtesy of Brian Enquist and his colleagues Geoffrey West and Jim Brown. West and Brown are no stranger to metabolic relationships—the pair described how metabolism changed with body size (it follows a power law, naturally).

The trio put together a model which describes plant resource use based on the amount of water and nutrients a plant moves through its xylem, or the tube-like tissues found in a plant’s stem. Measuring xylem transport rates is a roundabout way of measuring total photosynthetic rate, which in turn lets you also determine metabolic rate. The logic goes something like this: The more water and nutrients a plant’s xylem can handle, the more it can photosynthesize and metabolize. From these measurements, they estimated that the way plants use resources scales at ¾ power. At first glance this seems way off from the -⁴⁄₃ exponent noted above, but it’s really just flipped. Plant ecologists tend to write the equation one way, while animal ecologists write it the other way. The two exponents are, in fact, equal.

Enquist, West, and Brown’s model may not completely sink Yoda’s law, though. They point out that their model doesn’t necessarily describe self-thinning of plant populations witnessed in the real world. Rather, their -⁴⁄₃ power relationship predicts how much plant biomass an ecosystem will produce based on its resources. A grassy ecosystem can have the same level of productivity as a forested one provided the same level of resources are available.

Sources:

Enquist, B., Brown, J., & West, G. (1998). Allometric scaling of plant energetics and population density Nature, 395 (6698), 163-165 DOI: 10.1038/25977

Marinus J.A. Werger, Masahiko Ohsawa, Mamuro Kanzaki, & Takuo Yamakura (1997). Obituary: Kyoji Yoda (1931–1996) Plant Ecology, 133 (2) DOI: 10.1023/A:1017190418074

Photo by Tatcher a Hainu.

Related posts:

Hunter-gatherer populations show humans are hardwired for density

The curious relationship between place names and population density

Creativity—the disturbance that distinguishes urban ecosystems

Spatial contagion in an urban ecosystem

Mimicking nature is nothing new for human beings. Ceremonial dress and dances have long imitated totemic animals. Leonardo da Vinci’s plans for a flying machine were closely modeled on the birds he saw out his window. And more recently, nature has inspired designers of everything from velcro to solar cell installations.

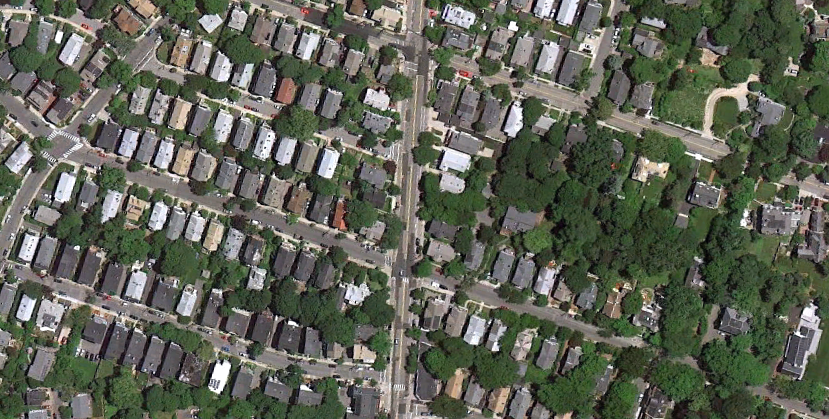
Cities and suburbs would seem to be an exception to that rule. They are arguably anthropogenic down to the last blade of grass. We pile dirt up and grade it down, plant grass and pull it from sidewalk cracks. But like other human endeavors, urban areas unwittingly imitate natural landscapes. Or more accurately, people tend to mimic each other, which in turn makes urban landscapes mimic natural ones.

Ecosystems are clumpy. They aren’t randomly distributed in small bits so much as they are consolidated into large associations—think forests, prairies, and so on.¹  It stands to reason that when people move in, the clumpiness of nature moves out. After all, yards are managed by individuals, each with their own tastes and preferences. Just because Sally plants a shrub doesn’t mean George will. But in reality, we’re not so creative. If Sally does plant a shrub, George is more likely to follow suit and so are the other neighbors. Thusly, neighborhoods take on specific ecological forms—a shrubland in this case.

The spatial contagion of landscaping was first demonstrated by two studies of the Hochelaga-Maisonneuve district in Montreal. Hochelaga-Maisonneuve is an old neighborhood that dates back to the mid-19th century and is complete with residential, commercial, and industrial zones, though most of the current houses were built between the end of World War II and 1970. Researchers drove up and down 17 streets, recording the spatial and floral characteristics of 646 front yards.

They discovered that the distance between two yards was responsible for 20 percent of the variation between them. In other words, next door neighbors are more likely to have similar landscaping than people three blocks apart. Next door neighbors were also more likely to have more similar vegetation than houses across the street from one another.² Lastly, the shape and size of the yard also drove landscaping choices. Together, they created a neighborhood that, when examined spatially, exhibited some of the same clumpy characteristics of natural ecosystems.

The reason, the researchers think, is because most of us tend to be pretty unoriginal when it comes to aesthetic decisions. They trot out the works of 19th century American philosopher Charles Sanders Pierce to support their case.³ Pierce proposed that there is no truth, only knowledge filtered by interpretation. In other words, one person’s knowledge is merely an interpretation of another person’s knowledge. Building on that, Pierce surmised that there were three types of human experience, which he cleverly called firstness, secondness, and thirdness. Firstness deals with sensory perceptions—smell, taste, touch, and so on. Secondness connects those sensory perceptions to another bit of information, say associating a smell with the type of flower, for example. Thirdness goes further, establishing symbolic links between two otherwise unrelated pieces of information, like the crunch of leaves underfoot and the beginning of the school year. Loosely, Pierce’s three levels of experience correspond with feeling, knowing, and understanding.

Most people in a neighborhood experience front yards on a primary or secondary level, the researchers suggest. People may take a neighbor’s landscaping and reproduce it wholesale—a primary interpretation—or add a little twist like planting a different variety—a secondary interpretation. Rare are the people who come up with entirely new ideas, the people who produce tertiary interpretations. Not all tertiary interpretations catch on—if a design is too daring, neighbors won’t mimic it—but those that do change the neighborhood. These people are the germs of spatial contagion in cities. Their creativity can begin a cascade of ecological change within cities.

Tertiary interpreters make urban ecosystems fundamentally different from other ecosystems—they have agency, unlike many other processes—yet strikingly similar—they are disturbances, like fires, hurricanes, and floods. They can drive widespread change like a giant forest fire or be confined to a yard like a small tree-fall gap in a forest. But no matter their scale, creative people are a distinct type of disturbance and one unique to urban ecosystems.


  1. While it’s true that our scale of perception is partly responsible—after all, we don’t consider a small patch of grass a prairie, though both contain grasses—there’s functional support for the distinctions between ecosystems.
  2. Across-the-street neighbors’ landscaping is more “in your face”, and so people strive to differentiate themselves more, the authors suspect.
  3. This is where things get heavy, man.

Sources:

Julien, M., & Zmyslony, J. (2001). Why Do Landscape Clusters Emerge in an Organized Fashion in Anthropogenic Environments? Landscape Research, 26 (4), 337-350 DOI: 10.1080/01426390120090139

Jean Zmyslony, & Daniel Gagnon (1998). Residential management of urban front-yard landscape: A random process? Landscape and Urban Planning, 40 (4), 295-307 DOI: 10.1016/S0169-2046(97)00090-X

Jean Zmyslony, & Daniel Gagnon (2000). Path analysis of spatial predictors of front-yard landscape in an anthropogenic environment Landscape Ecology, 15, 357-371

Photo from Google Earth.

Related posts:

An ecology of gardens and yards

Thinking about how we think about landscapes

The great (big) American lawn

Ghosts of geography

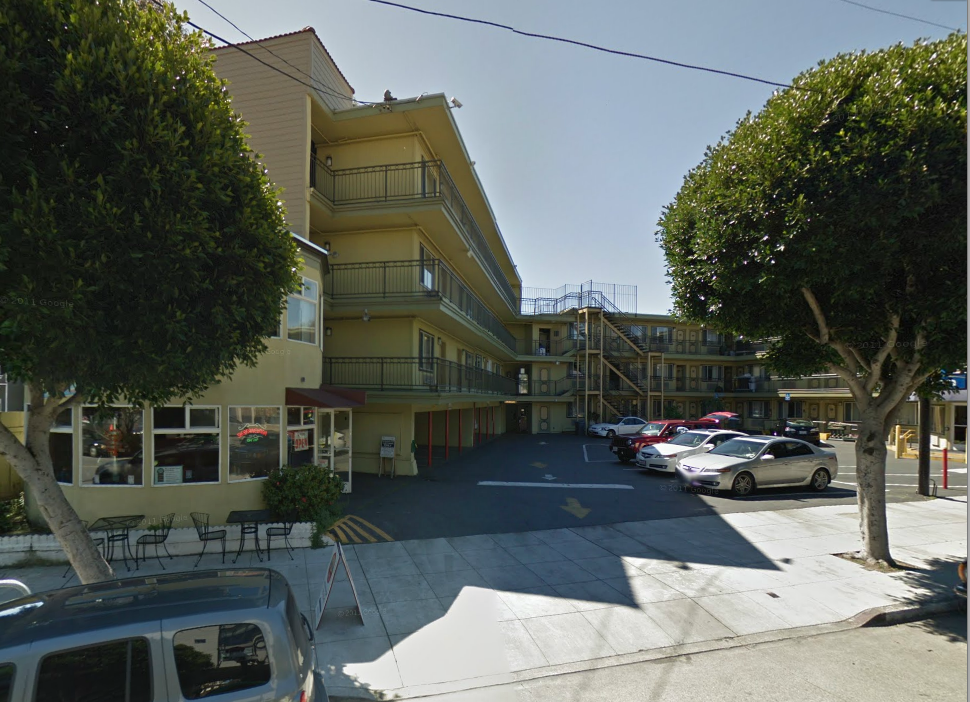
As I was walking home from work in San Francisco a number of years ago, a Days Inn caught my eye. The hotel itself is nothing special, but it sat at an odd angle to the street. Why would anyone build that way, I wondered. Next to it was a wide-open parking lot, something of a rarity in the city. Clearly, something had prevented the hotel owners from building on a rectangular footprint. But what could it have been?

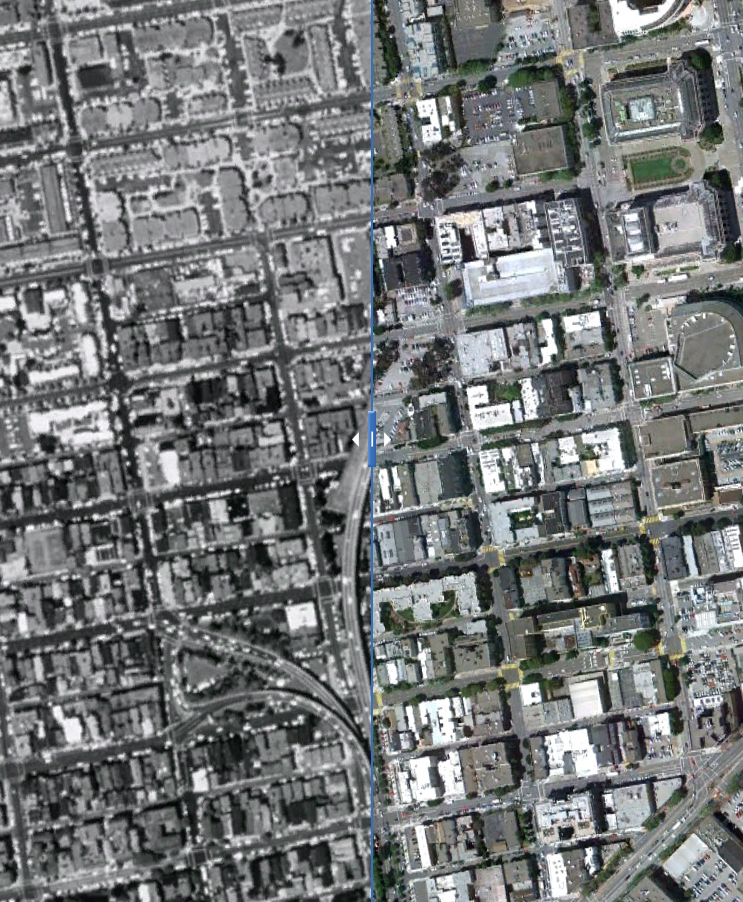
At home, I pored over aerial photographs of the building and the parking lot. Upon zooming out, the answer was apparent. A trail of parking lots and angled buildings snaked through the neighborhood back to the freeway. Oddly shaped buildings remained, accommodating an interloper that is now gone. The disruptive structure was a double-decker spur of the Central Freeway built in the 1960s amidst the San Francisco freeway revolts. Like other double-decker freeways in the Bay Area, it was badly damaged during the 1989 Loma Prieta earthquake and had to be removed.

Click to view interactive before-and-after photographs of Octavia Blvd.

click to view interactive version

Parts of the old right-of-way have been reclaimed. The old ramps leading to and from Fell St. and Oak St. are now the Hayes Valley Farm. Octavia Boulevard has been transformed into a bike and pedestrian friendly thoroughfare. And buildings now stand in other places.

Such ghosts of geography are everywhere. Old land uses and geologic processes can leave marks on the landscape that are sometimes blurred but not always expunged. Chicago is full of geographic ghosts that resulted from the removal of old train tracks. Trees trace the path of an old section of the Green Line.

Click to view interactive before-and-after photographs of Chicago's Green Line

click to view interactive version

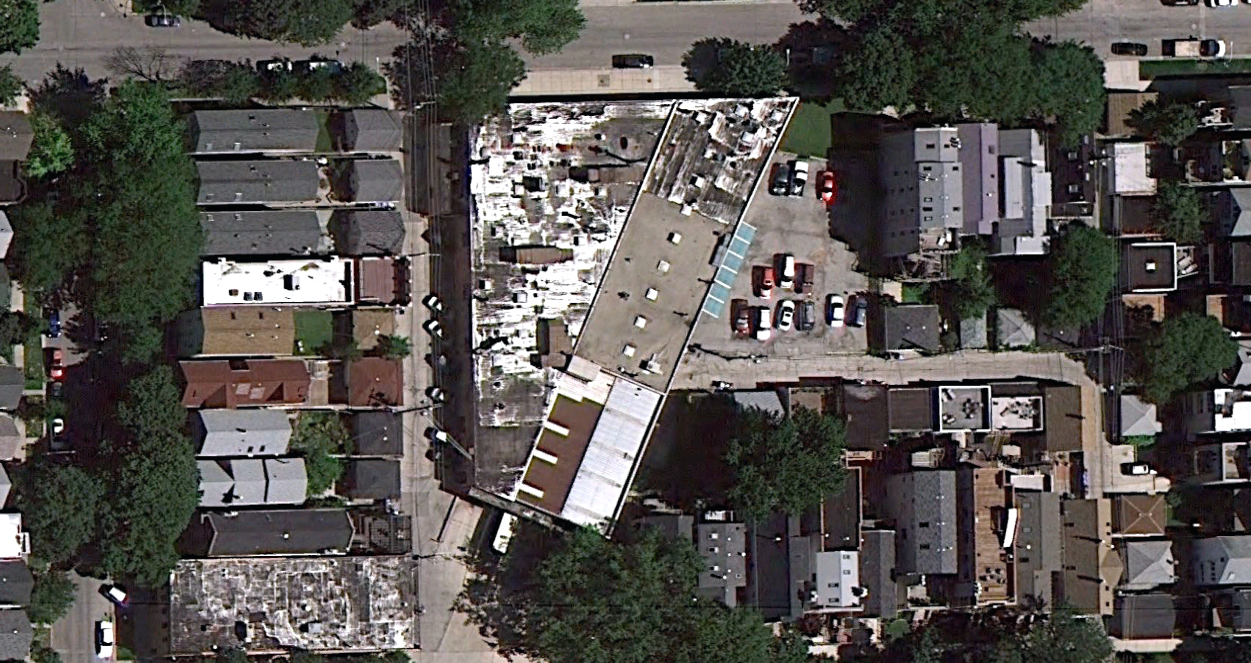
And buildings balloon to fill old right-of-ways formerly used by freight trains.

Building filling an old freight line right-of-way in Chicago

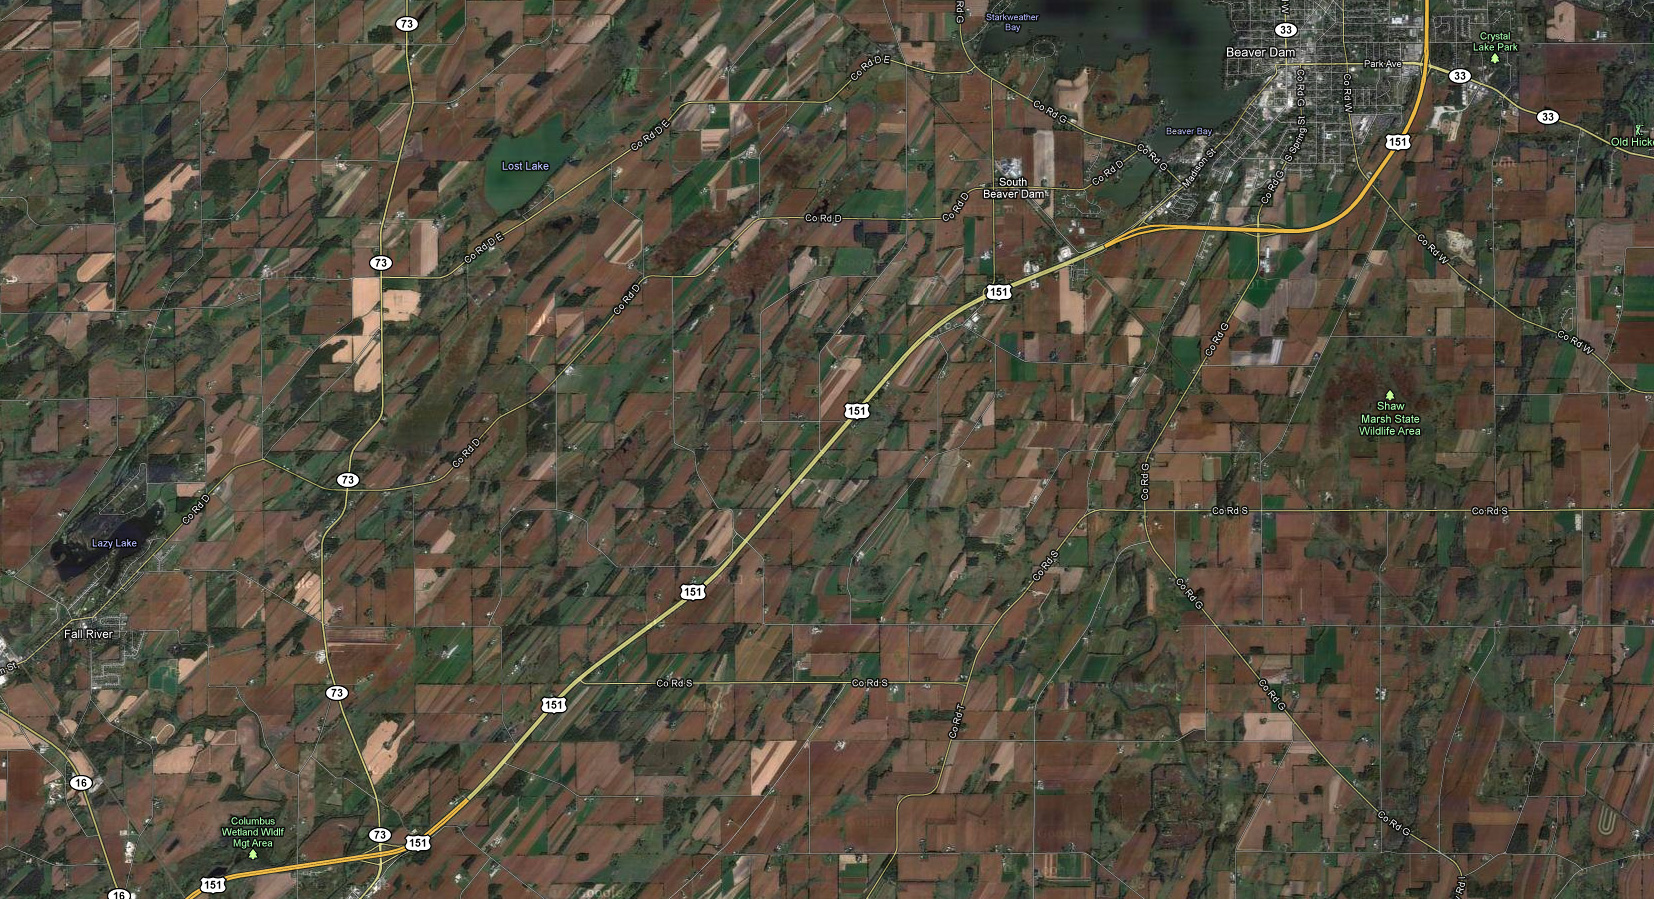
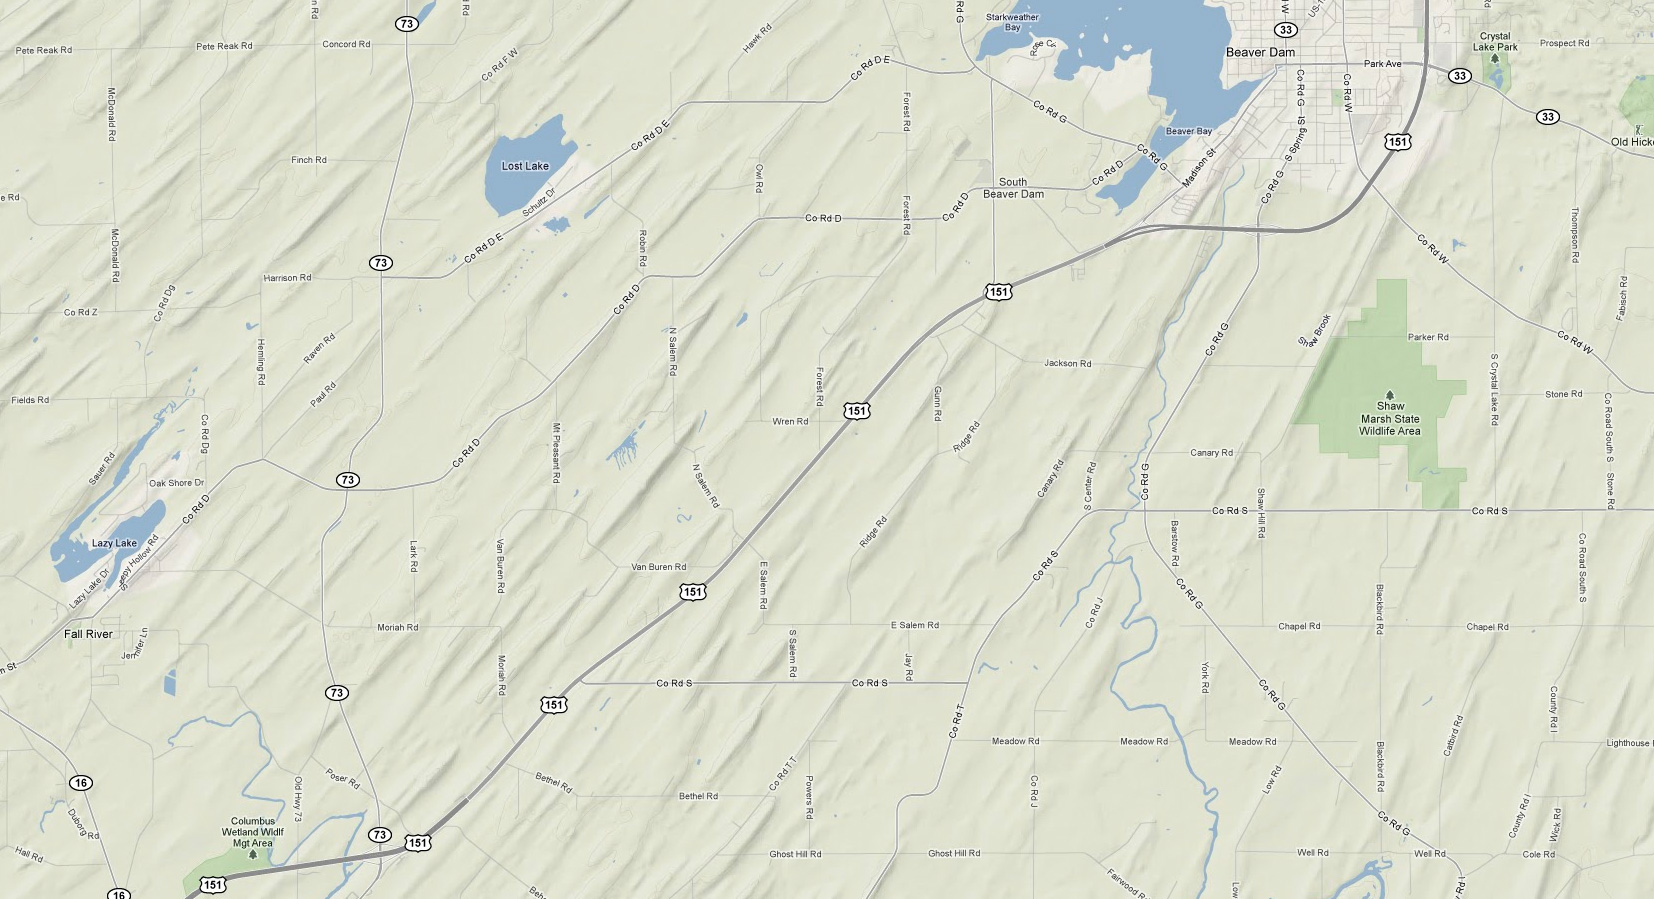
Even geology expresses itself in today’s land uses. Farmers planting on drumlins unwittingly map the direction of the Wisconsinan glaciers.

Aerial view of area around Beaver Dam, Wisconsin

Terrain view of area around Beaver Dam, Wisconsin

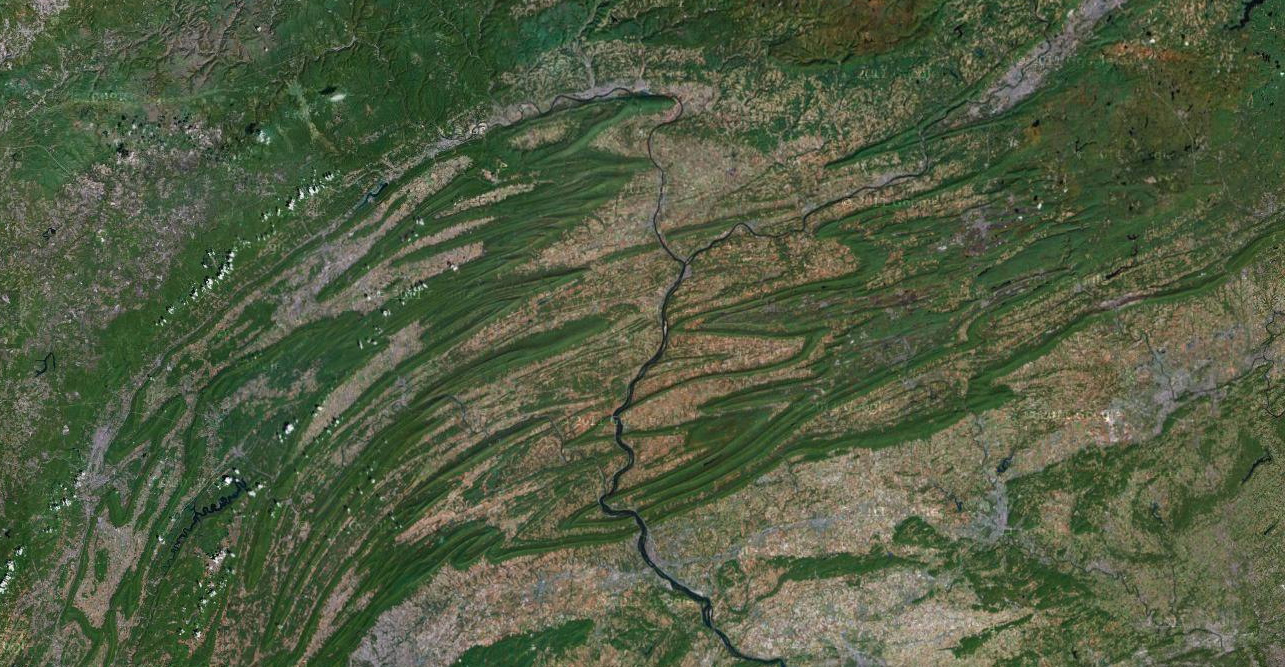
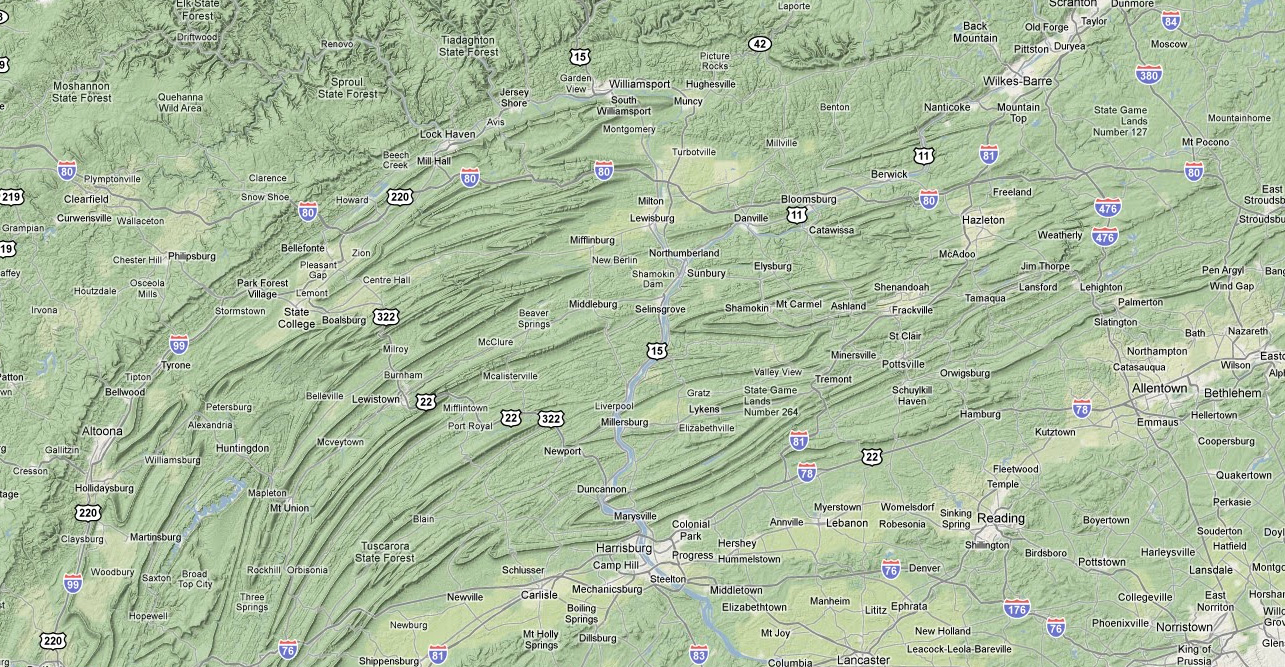
The Appalachian Mountains dictate where people farm and live.

Satellite view of Appalachian Mountains in Pennsylvania

Terrain view of Appalachian Mountains in Pennsylvania

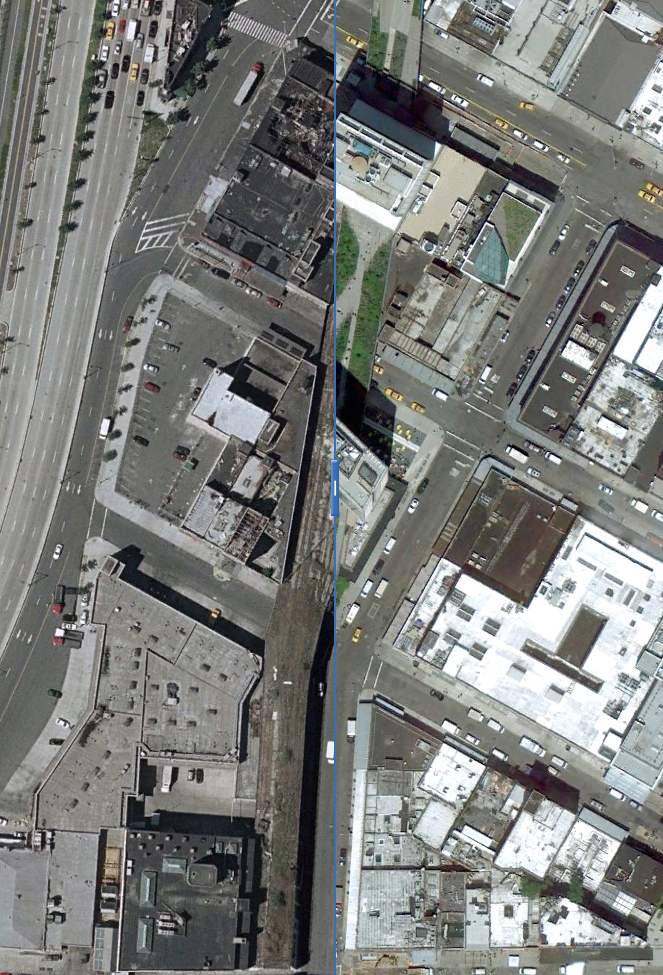
Ghosts of geography may be obvious, like New York City’s High Line…

Click to view interactive before-and-after photographs of New York City's High Line

click to view interactive version

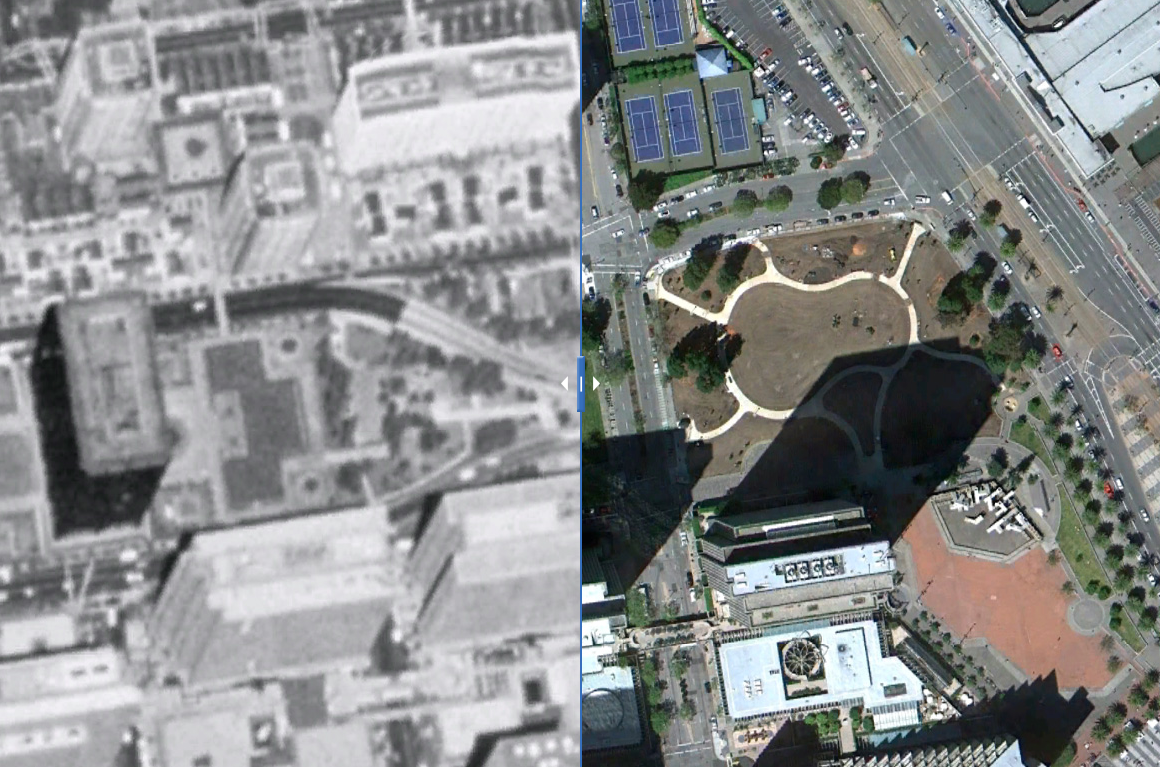
..or more subtle like the trees in Sue Bierman Park that used to line the on and off ramps that fed the now-dismantled Embarcadero Freeway in San Francisco.

Click to view interactive before-and-after photographs of Sue Bierman Park

click to view interactive version

The past is reflected everywhere in geography. What ghosts are in your neighborhood?

Related posts:

The woods that were

Density in the pre-Columbian United States: A look at Cahokia

Urban forests just aren’t the same

Farms giving way to subdivisions in Southeastern Wisconsin

If you were a squirrel living in Southeastern Wisconsin, you’d be pleasantly surprised by the state of things. In many places, there are as many—if not more—trees than there were 200 years ago. But that rosy image doesn’t tell the entire story. Comparing the forests that cover the cities and suburbs around Milwaukee—and likely in many places around the world—is like comparing Rome before and after the fall. It’s still Rome, but it’s not quite the same as it used to be.

Southern Wisconsin is a case study of the changes that were affecting much of the country in the 20th century. Most of the forests had been cleared in the 1800s by farmers, resulting in a landscape that little resembled what came before. The woodlots that remained were small and scattered. In one famous study, only 4.8 percent of the original forests remained by 1935. Milwaukee and its surrounding cities grew steadily in the run-up to World War II, but positively boomed thereafter. They needed room to grow, and since cleared land is easy to build on, farm after farm was subdivided.

The path from forest to front yard seems clear cut. A woods is cleared to make way for farmland, which is later subdivided into lots and sold off to make way for homes. But the reality is much more complex than that. Though a neighborhood may maintain its wooded appearance, it’s original character is gone.

In Wisconsin, subdivisions are invariably preceded by farms. Farming is a tough life. There’s not much money to be made with a small family farm, and an farmer’s property often doubles as his retirement fund. To maximize the investment, he’ll usually subdivide it for housing. It usually works out well for him, because land that’s good for growing crops is also good for building houses—it’s not too steep and most of it doesn’t need to be cleared.

That’s not to say farms are entirely devoid of trees. Most contain small woodlots and extensive fencerows that separated fields of corn, wheat, and soybeans. They’re relics of bygone forests, and in many places that’s all that’s left. Though the relationship is a bit one-sided, relic trees and farms have existed side-by-side for decades.

Maintaining that landscape during subdivision isn’t difficult. Building houses around trees is easy if you don’t take a cookie cutter approach, and houses with big trees in their yards tend to sell for more. But conservation rarely happens. That’s the conclusion of one study of Southeastern Wisconsin. It looked at the fate of extant vegetation as farms gave way to subdivisions between 1937 and 1975. Though the sum total of forested land didn’t drop as much as anticipated, very little of the original vegetation that made it through the transition. By 1975, the trees that dotted subdivisions and roadsides were almost entirely new.

That study reminds us that sum totals seldom tell an entire story. The relationship between forests, farms, and yards is complex and multidirectional. Forests are often cleared for farms, but abandoned farms can return to their forested state over time—much of New England underwent this process. However, urbanization can intervene along the way, removing the little remaining vegetation and replacing it with landscaped yards. But that’s not all the forest loss development is responsible for. Though many subdivisions are carved from land cleared previously for farms, they can be indirectly responsible for the loss of even more forests. Street and yard trees can’t offset this entirely. Similar patterns are well documented in developing nations. In Brazil, for example, expanding soy production has pushed cattle ranchers to clear land further into the frontier. It’s easy to forget these same processes are at work here in the United States.

Even when subdivisions spring fully formed from forested land—skipping the intermediate farm stage—their lots are often cleared of existing vegetation. Some of my research in graduate school documented the stark changes forest edges undergo when houses move in. In old black-and-white aerial photographs, the bare earth of cleared building sites stood out in stark contrast to the dark gray of the surrounding woodlands. Straight, sharp lines separated the two. In time, the edge bled back into the yards, but it wasn’t quite the same.

Suburban development isn’t going away anytime soon, but some of the structure and function of the old woodlands they replaced can be recovered. Homeowners can plant native trees. People can lobby their cities to plant native trees as well, rather than the whatever low-maintenance tree is in fashion among city foresters this year. The result won’t be the same as an intact woodland, but at least it will be similar.

Source:

Sharpe, D., Stearns, F., Leitner, L., & Dorney, J. (1986). Fate of natural vegetation during urban development of rural landscapes in Southeastern Wisconsin Urban Ecology, 9 (3-4), 267-287 DOI: 10.1016/0304-4009(86)90004-5

Photo by sierraromeo.

Related posts:

An ecology of gardens and yards

The map that started it all

Front yards, minus the grass

Salvaging disturbed forests may not save biodiversity

Never buy a car with a salvage title. Anyone who has ever driven a car after a major accident can tell you why—it’s just not the same as before the crash. Though all the parts might be in the right place and the paint just as shiny as before, there’s invariably some new rattle, shake, or whistle that you can’t fix. The magic that is gone, and nothing will bring it back. Cars are a lot like primary tropical forests in that way.

Biodiversity thrives in undisturbed tropical forests. But once they have been selectively logged, burned, or leveled, what grows back in their place just isn’t as rich, vibrant, or diverse as the original, according to a new paper released online today in Nature. The meta-analysis—written by a number of authors including Bill Laurence and Tom Lovejoy, two deans of tropical conservation—synthesized 2,220 pairwise comparisons of primary and disturbed tropical forests from 138 different studies on four different continents to arrive at that one conclusion.

The dominant image of deforestation—at least from an American perspective—is the Amazon. Photographs and satellite images of logging and agricultural conversion show in graphic detail splintered tree stumps, smoking ashes, and herringbone tentacles of human influence. But while the authors found South American forests are greatly threatened by human disturbance, Asian forests are even more imperiled.

To compare results from numerous studies, the study’s authors the measured effect size of human disturbance on biodiversity. It’s a statistical technique which describes the magnitude of differences between populations. The effect size of land-use changes in Asia was more than twice that of second place South America and even larger still than those of Africa and Central America.

To give you an idea of the severity of Asia’s biodiversity threats, let’s review the guidelines on interpreting effect sizes. Generally, a small effect size is 0.2, medium is 0.5, and large is 0.8 and above. In the study, Central America checks in at 0.11, Africa at 0.34, and South America at 0.44. (A quick caveat before we continue: The African result may not be representative. The continent’s tropical forests are understudied because of continued conflict, and future disturbance rates could accelerate in the face of population growth.) Asia is far ahead of the rest of the pack, blowing them all away with an effect size of 0.95.

Asian tropical forests are more threatened by every type of human impact than tropical forests on other continents. Agricultural conversion is responsible for a large portion of biodiversity loss in the region, with plantations and selective logging operations following not far behind. Plantations are of particular concern because the crops they yield—primarily palm oil and exotic woods—are lucrative. Their profit potential draws interest not only from multinational corporations, but governments as well. These organizations have large amounts of capital and can convert vast tracts of primary forest into ecologically sterile plantations that practically print money.

Plantations also have the advantage—for governments and corporations, at least—of looking deceptively like natural forests to many people. Asia Pulp & Paper, a company with large plantation holdings throughout Southeast Asia, has been exploiting this confusion through a series of recent TV ads. The Indonesian government has been in on the ruse, too, suggesting that it may push for their plantations—many of which were carved from primary forests—to count as forest land under REDD schemes, or reduction of emissions through deforestation and forest degradation. That means the government would not only profit from the plantations’ crops, but also from international payments to purportedly offset or reduce carbon emissions.

If we have to use forest land at all, the best bet to preserve biodiversity seems to be selective logging. Though the practice still harms overall biodiversity, it does so less than other land uses. Still, the paper’s authors caution that selective logging’s ill effects may be masked by proximity to less disturbed primary forests, which may export species to depauperate tracts. If this is the case, then selectively logged areas may be running the ecological equivalent of a trade deficit with primary forests. Without some reciprocation, the two will eventually go bankrupt.

This new meta-analysis confirms what many ecologists have long suspected—that minimally disturbed primary forests are some of the best bastions of biodiversity. It puts another hole in the idea that agroforestry projects, plantations, and even selective logging can extract resources without adversely affecting ecosystems. Like a car that’s been in an accident, primary can never be the same as before. But unlike cars, we can’t go out and buy new ones.

Source:

Gibson, L., Lee, T., Koh, L., Brook, B., Gardner, T., Barlow, J., Peres, C., Bradshaw, C., Laurance, W., Lovejoy, T., & Sodhi, N. (2011). Primary forests are irreplaceable for sustaining tropical biodiversity Nature DOI: 10.1038/nature10425

Photo by WWF Deutschland.

Related posts:

Spare or share? Farm practices and the future of biodiversity

Coaxing more food from less land

Can we feed the world and save its forests?
The importance of sentimental landscapes

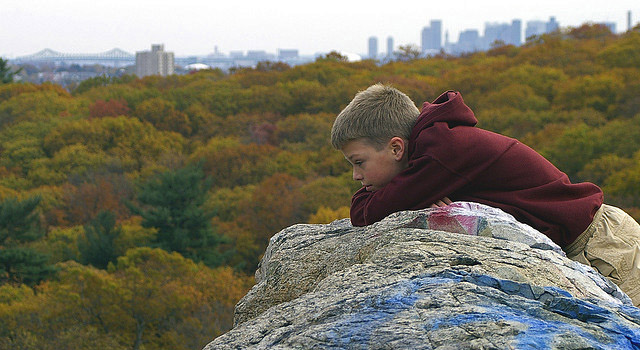
Looking out from Melrose Rock

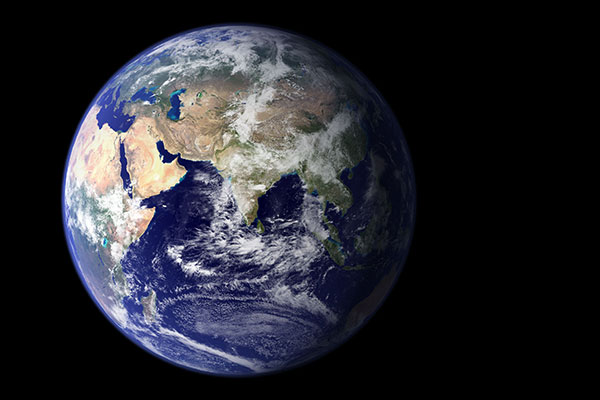
When I was packing for the move from Chicago to Cambridge, I figured the transition would be easy for two reasons, both of which are related. First, the two cities share a temperate climate. I grew up in Wisconsin and love—absolutely love—the changing seasons. For example, I’m not merely unfazed by below zero weather, I revel in it. The second reason is partially a consequence of the first—the Midwest and New England share a similar flora. Deciduous forests were the playground of my youth, where I went to escape the heat of the summer or romp through the snowy winter.

Having been a Cantabrigian for just just over two months, I can’t speak to the winters yet. But I can say something about the plants. A jaunt to Middlesex Fells over the Labor Day weekend affirmed my fondness for temperate deciduous forests. Still, I wasn’t quite at home. The Fells has a marvelous mix of deciduous oaks and evergreen pines perched on rolling hills and rocky outcrops. The whole landscape is reminiscent of the Calvin and Hobbes cartoons I devoured as a kid, but there was something missing. That something is my history with the place, or lack thereof. Research confirms it.

I wasn’t a part of the study in question—it took place almost a decade ago—but its findings confirm why I am both predisposed to liking New England’s woods and why they aren’t quite home yet. The study’s authors surveyed 328 park users in Ann Arbor, Michigan, to see whether they were attached to a particular park or just a particular setting. The study’s authors classified participants as park neighbors, visitors, volunteers, or staff, reasoning that these backgrounds would tint the lenses through which people viewed the parks.

The researchers found that neighbors who frequented a particular park were smitten by that place in particular. Perhaps the bond was formed during solitary reflective walks, or maybe weekend picnics with the family. Regardless, they liked those place in particular and didn’t find substitutes as appealing. Park volunteers and staff, however, were more inclined to treasure a park’s ecological contributions rather than sentimental ones. When shown photographs of a particular ecosystem, say a prairie, volunteers and staff were more likely to rate those shots highly regardless of their location. Volunteers and staff, who the researchers reasoned to be more ecologically knowledgeable, were also more open to restoration projects that supplanted invasive species with natives. Park neighbors and visitors tended to be happy with the landscape the way it was and generally opposed changes.

The differing perspectives of sentimental park users and ecologically principled individuals may help explain my hesitant fondness for the Massachusetts wilderness. The study seems to confirm that I straddle the line between two types of people. I have a feeling that many people are like me, especially those who recently moved. Our sentimental side aches for a favorite tree or preferred vista, but the rational ecologist in us appreciates native plant assemblages and landscapes.

People develop not just an affinity for nature, but the nature outside their window. That suggests not only that we should get outside, but also bring the outdoors closer to home, whether that be in the form of a city park or wild backyard. First-hand experiences with nature can be powerful ways to inspire people to adopt their own environmental ethic. I’m not the first to posit this theory—David Gessner does just that in his book My Green Manifesto, which I’m currently reading, as have others before him. Indeed, I can trace part of my own environmental ethic to a childhood spent in the park down the street or at the seven acres of scrubby, overgrazed woods just outside of town that my dad was rehabilitating. They are the type of landscapes I love and am fighting to preserve. Indeed, part of the reason I’m fascinated with higher density living is the potential it has to keep the wild places wild, the semi-wild places semi-wild. Calvin and Hobbes’s zany woodland adventures captured my childhood imagination because I saw in them a bit of my own al fresco self. I want future generations to have that chance, too.

Source:

Ryan, R. (2005). Exploring the Effects of Environmental Experience on Attachment to Urban Natural Areas Environment and Behavior, 37 (1), 3-42 DOI: 10.1177/0013916504264147

Photo by Paul-W.

Related posts:

Thinking about how we think about landscapes

Wilderness housing boom challenges conservation

16,422 people per square mile

Spare or share? Farm practices and the future of biodiversity

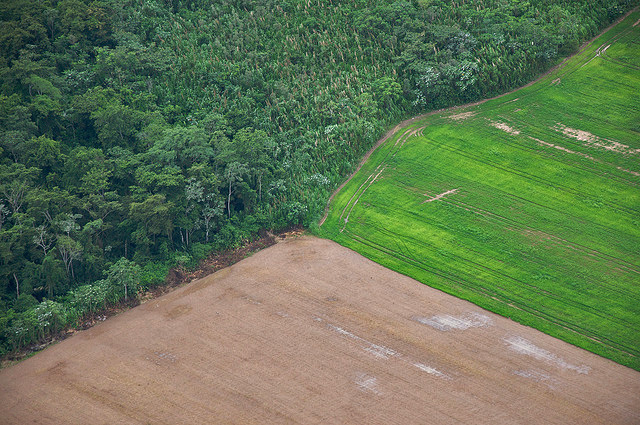
Forest-farm edge in the Bolivian Amazon

Farming giveth and farming taketh away. Let’s parse that statement: Farming provides food—that much is obvious. But farming also gobbles up land that would otherwise accommodate endless biodiversity and beneficial ecosystem services. To counter the ecological harm done by farms, we have two options. One is to make farming more ecosystem friendly. Known as land sharing, this choice differs from garden variety organic farming by enmeshing cultivation with conservation rather than just minimizing detrimental impacts. The other option, land sparing, intensifies current cultivation while leaving other land as wild as possible. If you’re looking to feed people and maximize biodiversity conservation, you have to pick one.

The correct answer, at least according to a study published today in Science, is land sparing. The study’s authors examined farms and forests in southwest Ghana and northern India. They found more overall diversity of bird and tree species per square kilometer in land sparing setups—where farming is intense and reserves off limits—than in land sharing schemes—where farming and conservation occur on the same plot of land.

The ecologists involved in the study mapped out 25 one square kilometer plots in Ghana and 20 in India. The Ghanaian plots were divided almost equally among forest (8), large-scale oil palm plantations (8), and forest-farm mosaic (9). In India, they were split among five forest and 15 farm plots, five of which were low yield and ten of which were high yield. In each plot, the researchers measured average population densities of bird and tree species and binned each species into two broad categories—those that would thrive under a particular farming regime and those that would suffer. They then compared biodiversity statistics for land sparing regions (which contained both farmed and forested plots) with land sharing ones.

Unsurprisingly, all species fared worse when land was farmed. But the disheartening part—at least for those of us who dream of harmonious, ecotopian farms—was that more species were worse off on a region-wide basis under land sharing than land sparing. So although land shared between farm and forest is better for biodiversity on a single plot scale, the overall region is better off when some plots are intensively farmed and others are left alone.

In other words, sparing appears to be the least worst option. While some generalists thrive under land sharing, less mobile species with higher habitat constraints need special protection. Habitat reserves provide that, and land sparing schemes can support larger reserves. The only way land sharing excels at protecting biodiversity is when farm yields are impossibly low.

Land sharing, then, is the futon of biodiversity conservation. Just as a futon is both a middling bed and mediocre couch, land sharing is merely passable at producing food and so-so at protecting biodiversity. Neither futons nor land sharing systems excel at their dual tasks. As The Dude in The Big Lebowski would say, “This is a bummer, man.”

One drawback of land sparing is that it requires an immense amount of self-control on the part of individuals and society as a whole. Time and again we’ve challenged the inviolability of protected areas when we are—or think we are—short on resources. Conservation is hard, and plowing more land will always be the easier option. To prevent ourselves from doing that, we need to raise yields, which takes resources, training, and discipline. None of this will be easy.

Furthermore, raising yields sustainably, which the authors endorse, is going to be difficult. There are certainly some easy places to start—yields in much of Africa are dishearteningly low. But the world has embraced fossil fuel-driven, industrial agriculture for a reason—it’s the easiest way to squeeze more food from the land. If non-fossil fuel farming were the easiest option, we would have done that by now. Land sharing, on the other hand, trades low yields for closeness to nature. Locally this may be more sustainable, but is there enough land to feed 10 billion people that way? Probably not.

The choice between land sparing and land sharing is just one of many we will face as the planet’s resources stretch thin. While I’m quietly rooting for integrated, ecologically friendly approaches, there seems to be growing evidence that intensively exploiting a limited footprint may be the better option. If that’s true, the Romantic in me hopes we don’t lose our connection with nature in the process.

Source:
Ben Phalan, Malvika Onial, Andrew Balmford, & Rhys E. Green (2011). Reconciling Food Production and Biodiversity Conservation: Land Sharing and Land Sparing Compared Science, 333 (6047), 1289-1291 : 10.1126/science.1208742

Photo by Sam Beebe / Ecotrust.

Related posts:

Coaxing more food from less land

Small farms in modern times

Can we feed the world and save its forests?
Front yards, minus the grass

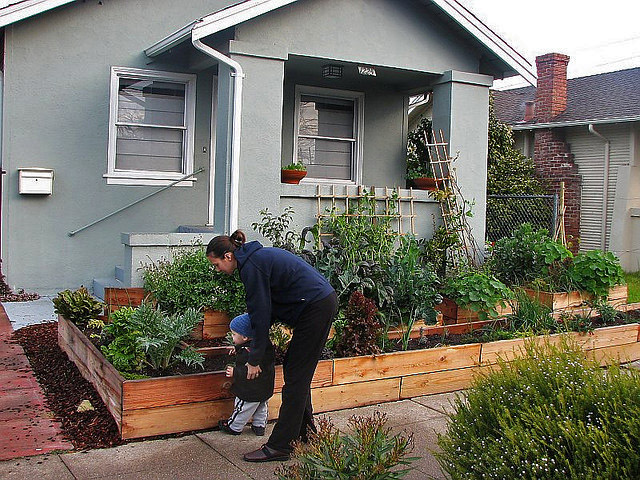
Berkeley front yard

If you were on a quest to rid the world of excess turf grass, the front lawn would be a good place to start. No one does anything with their grassy front lawn except mow it. Back yards are far more amenable to relaxation and play—they’re sheltered from the noise of the street, protected by a large, immobile structure, the house. Front lawns dominated by grass are, for the most part, wasted space. This also makes them the perfect place to start developing ecologically sound landscapes in cities. But a quick trip through nearly any city, small or large, in the United States and Canada reveals the size of the fight ahead. In the front yard, lawns still rule.

It doesn’t have to be that way. Though most tend to toe the line when it comes to front yard lawns, people are surprisingly open to alternative landscaping, with one proviso—that it’s not a messy mass of weeds. Joan Nassauer showed this in her pioneering work in the early 1990s. In it, she presented seven types of simulated front yards to over 200 people from the Minneapolis-St. Paul suburbs and asked their opinions. About a third of those people had some knowledge of native plants while the others did not. Treatments ranged from conventional turf grass to messy weeds to native prairie and more. While the less knowledgeable people tended to prefer conventional lawns, they were amenable to yards with 50 percent native prairie grasses. The key to buy-in amongst non-floraphiles was a yard’s overall orderliness. Native grasses were deemed attractive provided that they were bounded by neatly trimmed turf grass.

This post was chosen as an Editor's Selection for ResearchBlogging.orgClearly, people are not as wedded to turf grass front lawns as we might suspect. But translating that open-mindedness into action is another task entirely. One Canadian study suggests that people are hesitant to break free of the lawn for a number of reasons. Peer pressures is high on the list. If your neighbor has a mowed lawn, you’re more likely to have the same. But beyond social compulsion, physical structure of the neighborhood plays a role. Older neighborhoods with small front yards and tall trees tend to have more “alternative” front yards, because smaller yards lend themselves to more creative landscaping and homeowners may not want to own a lawnmower to tend a tiny strip of grass. Finally, tall trees in older neighborhoods make growing grass notoriously difficult. There were a few problems, however. Alternative front yards were not common, and where they were, grass was most often replaced with non-native ornamentals.

Don’t take those results as gospel, though. You may have noticed that I used a lot of qualifiers in the previous paragraph. That’s because the study it summarizes is rife with shortcomings. Many of those are probably to be due to the date of publication, 1998. While sophisticated geographic information systems (GIS) and statistical packages were available then, their use wasn’t widespread. The study’s authors had the right ideas, and if the study were redone today with updated methods, the results would be far more convincing.

Here’s why. The researchers mapped front yards and classified them by type of planting—20 percent or less turf grass, 40 percent or less turf grass, and everything else—but then failed to apply any spatial statistics to quantify the city-wide distribution of alternative yards. They also estimated road widths and lawn sizes, but only in relative terms. Such data would be relatively easy to come by these days, either with GIS layers or the use of laser range finders. Nor did the authors associate their data with census tracts or tax records, which would have added meaningful socioeconomic dimensions to their analysis. In short, the paper feels like an old ecology paper—lots of qualitative observations with little hard data to support their conclusions.

That’s not to say the authors don’t propose some insightful reasons why alternative lawns appeared where they did: Tall trees give a sense of enclosed space, which may encourage people to make an “outdoor room” of their front yard. Small parkways between the sidewalk and road are easier to landscape than large ones, thus fostering grassless experimentation. And tiny yards make homeowners ask, “Why bother mowing?”

It may seem like I’m at war with the lawn and turf grass in general. I’m not—in fact, I’m a bit of a fan. Rather, I’m arguing against useless lawns. I firmly believe that lawns play an important aesthetic and recreational role in cities. It’s just that front yards don’t play that role very well. They don’t support recreation in the same way back yards do—for example, it’s easier to play catch when you don’t have to worry about a ball rolling into the street. And regarding aesthetics, it’s clear that lawns do not have to be entirely turf grass to be socially acceptable. The key is care, as Nassauer would say. People welcome nature in the city so long as its curated. Think of turf grass front yards as blank canvases—I use that cliché because I mean it somewhat literally. So long as front yards are matted and framed by kempt grass, we are free to plant whatever we like. I say it’s time to start painting with something other than a turf grass brush.

Sources:

Henderson, S. (1998). Residential lawn alternatives: a study of their distribution, form and structure Landscape and Urban Planning, 42 (2-4), 135-145 DOI: 10.1016/S0169-2046(98)00084-X

Nassauer, Joan Iverson (1993). Ecological function and the perception of suburban residential landscapes Managing Urban and High Use Recreation Settings, General Technical Report, USDA Forest Service North Central Forest Exp. Sta., St. Paul, MN., 55-60

Photo by hortulus.

Related posts:

An ecology of gardens and yards

The great (big) American lawn

Plants rockin’ the suburbs, animals not so much

In race against fire, only the fleetest trees survive

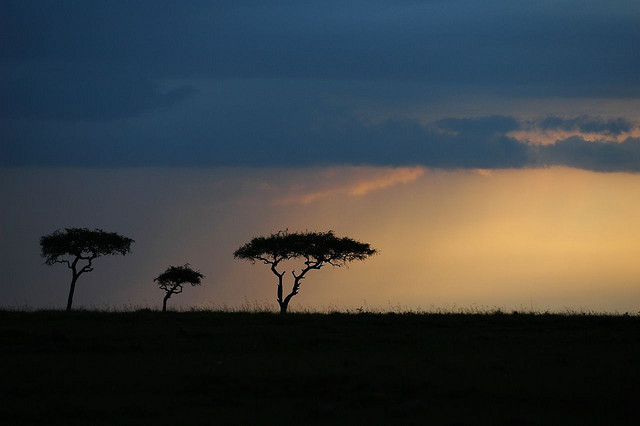
Acacia tortolis trees on the African savanna

Density matters. That’s the premise of this blog, after all. The number of people per square mile influences the character of a place—a topic I’ve covered repeatedly—but human population density isn’t everything. Take savannas. They are ecosystems defined by density.

Savannas are grasslands dotted with trees—not too many and not too few. They can have no less than 20 percent tree cover and no more than 80 percent. They exist thanks to fire, a devastatingly destructive natural process that keeps the trees in check. If fires occur too often, they will strip a savanna of its trees and revert it to prairie. If they become to infrequent, trees will takeover and the savanna will become a forest. Yet for all its power in shaping ecosystems, fire matters inasmuch as it can keep trees from breaking through to the canopy. Growth is a tree’s countermeasure. If a sapling can stretch skywards with enough haste, its tender apical buds can escape a fire’s most intense heat and survive. Savannas are shaped by more than just frequency of fire, then. They are held in balance between destruction and development.

That balance is confirmed by a study of three Acacia species—A. karroo, A. gerrardii, and A. tortolis—in South African savannas. The paper’s authors wanted to see what it takes for a tree to reach the canopy before fire returned. In South African savannas, that’s quite a lot. Fires typically burn every 2.9 years in drier areas and every 3.8 years in wetter areas. Occasionally, the interval slips to 10 years. Between 2000 and 2007 when the scientists were measuring the trees, three fires swept through—one each in 2000, 2002, and 2004.

Most trees couldn’t grow fast enough. On average, A. tortolis and A. gerrardii saplings grew about 11 to 14 cm per year, respectively, A. karroo saplings at 25 cm per year. None of these are quick enough for the trees to make it to the canopy height of 3 meters (about 10 feet) in 10 years, let alone a more typical 3 to 4 year interval.

The saplings most likely to make it to the canopy, the ecologists found, were the swiftest growers. In the savanna, “Only the exceptional become trees,” the authors wrote. They speculate that savanna canopy trees are not only bequeathed with superior genes, they also have the good fortune of growing in rich, wet soil without suffering ravenous herbivores or stiff competition from grass. But even with all these advantages, the fleetest 5 percent still need longer than 3 to 4 years to graduate to the canopy. Longer fire-free periods appear to be necessary to maintain a savanna.

Density in the savanna is the result of a complex set of processes that settle into a delicate balance. There’s so much going on it’s like a symphony of ecological interactions: Staccato fires interrupted by brief yet unpredictable intermissions, an orchestra of trees performing a slow march, and a handful of virtuoso trees playing at a furious pace.

Savannas occupy a sweet spot of tree densities, one that is both visually appealing and ecologically important. One of the largest savannas, the Serengeti, is home to some of the world’s most charismatic fauna. Others probably fostered the rise of our own species. Even more prosaic ones host thousands of wonderful and endangered species. But savannas are imperiled, with fire suppression turning them into forests and climate change messing the life cycles of their constituent species. Anything that upsets one part of a savanna or another threatens to undo the whole system. That’s precisely why they are among the world’s most endangered ecosystems, and why they need to be protected.

Source:

Wakeling, J., Staver, A., & Bond, W. (2011). Simply the best: the transition of savanna saplings to trees Oikos DOI: 10.1111/j.1600-0706.2011.19957.x

Photo by Kalense Kid.

Related posts:

The woods that were

Managing landscapes for aesthetics

Can we feed the world and save its forests?
Hunter-gatherer populations show humans are hardwired for density

People represented in a cave painting

This post originally appeared on Scientific American’s Guest Blog.

High density living seems like a particularly modern phenomenon. After all, the first subway didn’t run until 1863 and the first skyscraper wasn’t built until 1885. While cities have existed for thousands of years—some with population densities that rival today’s major metropolises—most of humanity has lived at relatively low densities until recently, close to the land and the resources it provided. Before farming, nearly everyone was directly involved in the day-to-day hunting and gathering of food, which required living at even lower densities. It would seem as though our current proclivity for high density living runs counter to our biological underpinnings, that density has been thrust upon us by the demands of modern life.

This post was chosen as an Editor's Selection for ResearchBlogging.orgIt’s easy to arrive at that conclusion, in part because density is a hot topic these days. More than 50 percent of the world’s population now lives in cities—a fact repeated so often it’s almost a litany. But reciting that phrase doesn’t reveal the subtle effects implied by the drastic demographic shift. People migrating from the countryside face untold challenges wrought by density. Cities are complex places, fraught with crime, diseases, and pollution. Yet cities are also places of great dynamism, creativity, and productivity. Clearly, the benefits outweigh the drawbacks or else cities would have dissolved back into the landscape.

The benefits of living close to other people are evident even to hunter-gatherers. Though their societies have changed over the millennia, studying characteristics of present-day hunter-gatherers can let us peer into the past. That’s what was done by three anthropologists—Marcus Hamilton, Bruce Milne, and Robert Walker—and one ecologist—Jim Brown. In the process, they seem to have discovered a fundamental law that drives human agglomeration. Though their survey of 339 present-day hunter-gatherer societies doesn’t explicitly mention cities, it does show that as populations grow, people tend to live closer together—much closer together. For every doubling of population, the home ranges of hunter-gatherer groups increased by only 70 percent.

The way home ranges scale with population follows a mathematical relationship known as a power law. Graphs of power laws bend like a graceful limbo dancer—sharply at the base and more gradually thereafter—toward one axis or another, depending on the nature of the relationship. They only straighten when plotted against logarithmic axes—the kind that step from 1 to 10 to 100 and so on. One variable, known as the scaling exponent, is responsible for these attributes.

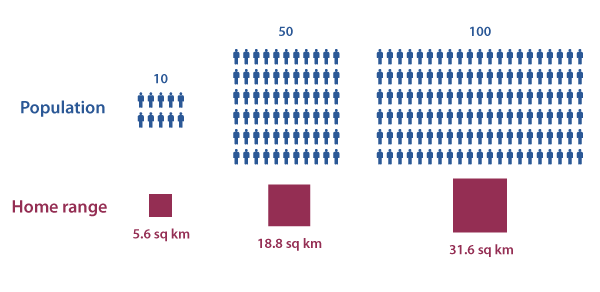
Hunter-gatherer population size and home range (updated)

Fig. 1 Hunter-gatherer home ranges scale to the three-fourths power. Above are representations of three populations and the size of their home range according to this relationship.

To see how scaling exponents apply in the case of hunter-gatherer territories, let’s look at the range of possible values and what each would mean in terms of density. If the exponent were equal to one, then home ranges would scale linearly with population size—10 people would occupy 10 square miles and 100 people would occupy 100 square miles. If the exponent were 1.2, then a group of 100 would occupy 250 square miles. And if the exponent were 0.75, a group of 100 people will only occupy 32 square miles. This last one is what Hamilton and his co-authors found.

Their result is the average of 339 societies, and there’s a bit of heterogeneity within that statistic. Not every group has a perfectly “average” way of hunting and gathering. Some hunt more, some gather more. Some find food on land, others in the water. Where and how hunter-gatherers get their food has a large impact on how densely they live, causing the density exponent to deviate slightly or greatly from three-quarters. For instance, groups which derive more than 40 percent of their food from hunting require larger territories because prey is not always evenly distributed or easily found. Their home ranges scale to the nine-tenths power, indicating sparser living. Gatherers require less space—their home ranges’ scale at the 0.64 power—largely due to plants’ sedentary lifestyles.

Hunter-gatherer societies which draw food from the water lived more compactly, too. The home range of aquatic foragers was consistently smaller across the range of population sizes—their exponent was 0.78 versus terrestrial foragers’ 0.79. Hamilton and his colleagues suspect this is because food from rivers, lakes, and ocean shores is more abundant and predictable than comparable terrestrial ecosystems.

But no matter what types of food are consumed, the overall trend remains the same. Every additional person requires less land than the previous one. That’s an important statement. Not only does it say we’re hardwired for density, it also says a group becomes 15 percent more efficient at extracting resources from the land every time their population doubles. Each successive doubling in turn frees up 15 percent more resources to be directed towards something other than hunting and gathering. In other words, complex societies didn’t just evolve as a way to cope with high-density—they evolved in part because of high density.

Update: The figure in this post originally reported 10.8 sq km for a group of 50 people. It should have been 18.8 sq km. The figure has been updated.

Source:

Hamilton, M., Milne, B., Walker, R., & Brown, J. (2007). Nonlinear scaling of space use in human hunter-gatherers Proceedings of the National Academy of Sciences, 104 (11), 4765-4769 DOI: 10.1073/pnas.0611197104

Photo by Gruban.

Related posts:

The curious relationship between place names and population density

Density in the pre-Columbian United States: A look at Cahokia

When it’s too crowded to have kids

Fushimi Inari Taisha, head shrine of Inari, the Japanese kami of fertility, among other things

Density can have profound effects on fertility. Population biologists call this phenomenon density dependence, and they’ve witnessed it in everything from single-celled organisms to elephants. It can influence fertility positively—individuals are more likely to meet mates in dense populations—or negatively—increased stress or lower food availability may drive fertility rates down. But despite evidence of the phenomenon in the natural world, little has been said about the its role in declining human fertility rates.

The relative paucity of studies examining density dependence in humans may be due in part to our persisting belief (conscious or unconscious) that in the course of developing culture, we have isolated ourselves from natural forces. Many previous studies of fertility rates tended to overlook what biologists see in the wild.

One study did, though. A demographic survey of around 150 countries, it uncovered strong evidence that population density is driving down human fertility rates. The authors accounted for all the usual variables found in fertility studies—infant mortality, gross domestic product per capita, percentage of women in the workforce, female literacy, and degree of urbanization. While those oft studied factors all still play a role, population density stood out as a new addition.

The researchers found that people throughout the world tend to have fewer kids when population densities are high, a pattern that repeated itself over the course of forty years. There were a few outliers—Australia has low population densities and low fertility while the Maldives has the opposite—but population density remained significant even when variables like infant mortality and GDP per capita included.

Density dependence was apparent even in the number of children people wanted, hinting that the cause may be more than just environmental. The authors used the Eurobarometer survey to see if people’s desires were aligned with population density. By and large, they were. People in sparsely populated Scandinavian countries desired more children, while people in the Netherlands wanted fewer. There were outliers, of course. The Irish continue to want larger families than average, the Germans fewer.

The exact mechanisms at work are still unknown. Density could be making food scarcer, or stress could be reducing fertility biochemically. Pollution may also be to blame. The psychological effects of crowding might be lowering libidos. Economics could be another driver. After all, many things are more expensive in higher density areas, whether that be food, shelter, child care, and so on. The truth is, we just don’t know at this point. But what should be clear is that culture and society have not insulated us from the forces of nature.

Source:

Lutz, W., Testa, M., & Penn, D. (2007). Population Density is a Key Factor in Declining Human Fertility Population and Environment, 28 (2), 69-81 DOI: 10.1007/s11111-007-0037-6

Photo by Miguel Michán.

The curious relationship between place names and population density

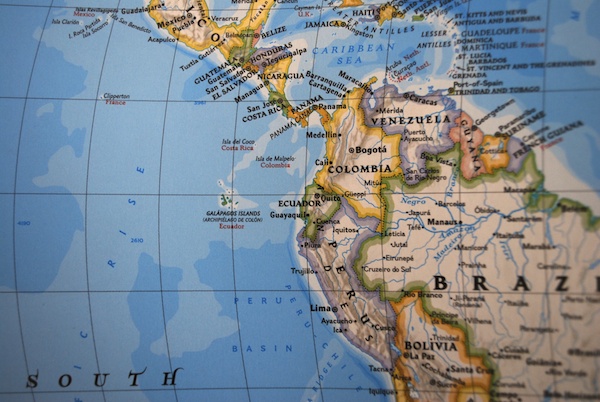
Political map with toponyms

Giving a name to a place is an important act. It says a place has meaning, that it should be remembered. For thousands of years, the way we kept track of place names—or toponyms—was by using our memory. Today, we’re not nearly so limited, and the number of toponyms seems to have exploded. Yet oddly enough, the number of places we name in a given area follows a trend uncannily similar to one seen in hunter-gatherer societies.

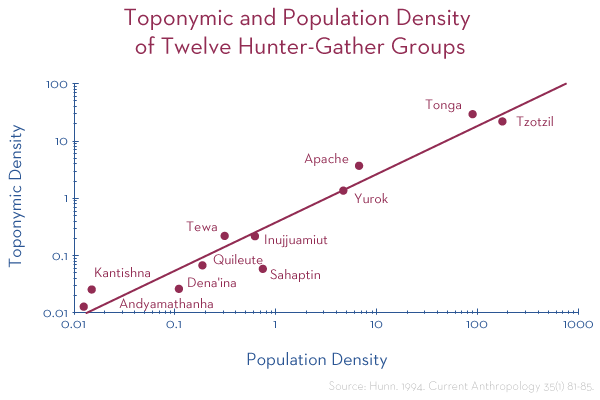
Eugene Hunn, now a professor emeritus of anthropology at the University of Washington, stumbled upon what appears to be a fundamental relationship between toponyms and population density when he published a paper on the subject in 1994. His discovery stemmed from a literature survey of twelve hunter-gatherer societies from around the globe. Hunn tabulated each society’s toponym repertoire and the size of their home territory to calculate the number of toponyms per square mile, or toponymic density. From this data, he distilled two trends.

First, the average number of toponyms converged on what he called the “magic number 500”. Hunn found that trend in a few other papers on topics like folk taxonomies of plants and animals, and he posited that the number was an inherent limitation of the human mind—that when relying on memory alone, individuals tend to retain names to 500 items per category. A hunter-gatherer, for example, may be able to name 500 different types of plants. Unfortunately, Hunn’s “magic number 500” wasn’t all that magical given the variability about it—individuals in the hunter-gatherer groups he studied actually recalled between 200 to 1000 toponyms. The concept doesn’t appear to have caught on in the academic world.

Hunn’s second finding, though, is more compelling. When he arranged the toponymic and population densities of the twelve hunter-gatherer groups on a graph, a clear relationship stood out. Where people lived closer together, the number of place names per square mile skyrocketed. Where they lived farther apart, they named fewer places per square mile. The figure, which I’ve reproduced below, appears to have a linear relationship. That’s an artifact of the logarithmic scale of the axes, which compresses the data as you move away from the origin. The scale is hiding a subtle curve, one that bends down as though the x-axis has roped the line and is pulling it closer.

Toponymic and Population Density of Twelve Hunter Gatherer Groups

The general trend in Hunn’s figure—that we name more places when living at higher densities—makes such good sense that I knew there had to be a modern corollary. Despite all our sophisticated maps and petabytes of computer storage, I suspected that we still hew to the same basic pattern as our hunter-gatherer forebears. So I dove into a simple yet relatively modern set of toponyms—the U.S. Postal Service’s ZIP code system.

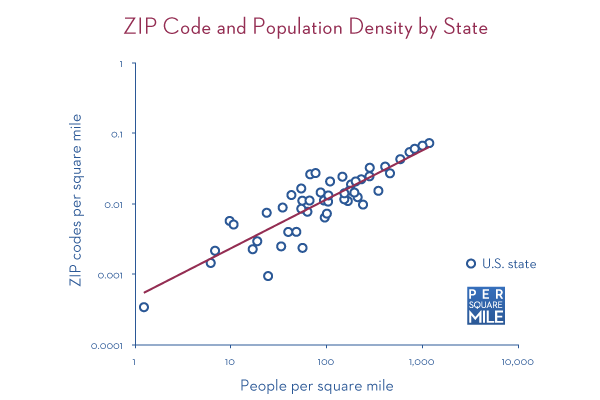
First proposed in the 1940s, ZIP codes were meant to speed the processing of mail at sorting facilities. Most major cities at the time were already divided into postal zones, like “Milwaukee 4”, but small towns and rural areas had no such system. Mail volume swelled after World War II, so the postal service introduced the Zone Improvement Plan in 1963. From what I can tell, there don’t appear to be any hard and fast rules about the size of ZIP codes. Exactly how they are delineated seems to be a postal service secret and one that likely depends on their logistical needs. They can even overlap. But none of that really matters, because ZIP codes give names to places. They’re toponyms. I suspected that the more densely populated states had a higher density of ZIP codes, just like in hunter-gatherer societies. And sure enough, they do.

ZIP code and population density by state

The wrinkle lies in the trend line’s curve, which is masked by logarithmic axes the same way the curve in Hunn’s figure is hidden. The best way to read both graphs is backwards, from right to left, from high population density to low population density, paying special attention to the scale of the axes. Before we start, we should assume one thing, that people name places at the same rate per square mile regardless of population density. In other words, people will name seven things per square mile regardless of whether they live at ten or 100 people per square mile. Returning to the graphs, if we start at high population densities on the right and move left to lower population densities, the curve drops below our straight line assumption. Not only do people name fewer things at lower population densities, they name fewer things per square mile than our fixed rate assumption would have predicted. In other words, a hypothetical group living at ten people per square mile will name only four things per square mile, compared with the seven named if the population density were 100 people per square mile.

That’s key. There are plenty of gullies and hillocks of grass in the Great Plains, for example, but few people. As such, we name fewer things per square mile. It makes navigation easier—fewer waypoints to remember when traveling—and keeps us focused on the resources that matter. After all, population density is often driven by resource availability, whether that be food, water, shelter, or some other necessity. It’s as though our minds can’t cope with vastness, and so we name fewer things to compress the interstitial space.

The intriguing part is that ZIP codes and Hunn’s hunter-gatherer toponyms are described by one particular mathematical relationship (a power law, for the interested math-types). Not only that, they’re following the trend in a strikingly similar way.¹ As humans, we seem to have settled on a comfortable way of describing the world regardless of whether we remember it with neurons or silicon.


  1. Toponymic density = 0.3675(population density)0.8388

    ZIP code density = 0.0005(population density)0.6944

Source:

Hunn, E. (1994). Place-Names, Population Density, and the Magic Number 500 Current Anthropology, 35 (1) DOI: 10.1086/204245

Photo by Tim De Chant.

Related posts:

Density in the pre-Columbian United States: A look at Cahokia

Thinking about how we think about landscapes

Scientific American Guest Blog: Why we live in dangerous places

Swedes move to the city, but don’t leave the forest behind

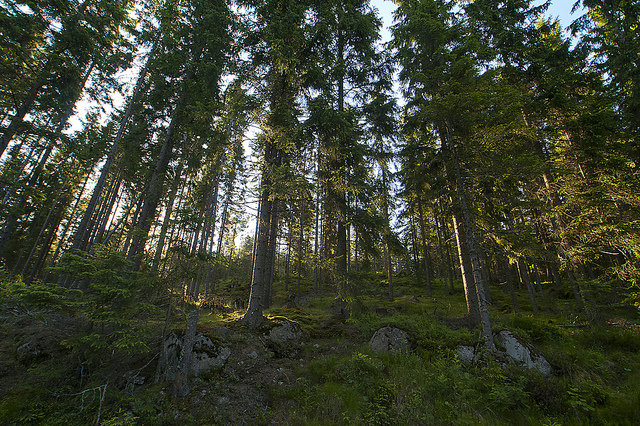
Swedish forest

If there’s one thing that comes to mind when you think of Sweden besides Ikea and meatballs, it’s probably forests. They cover nearly 70 percent of the country. As a result, Swedes have a very close relationship with their forests, though the nature of it has changed in the last few decades.

Swedish forests have traditionally been accessible to all, regardless of ownership. People could walk into any old forest to gather firewood or pick berries. Berries in particular hold a special place in Swedish hearts. People still take weekend walks to pick lingonberries and blueberries. In fact, the Swedes love their berries so much that one paper from 1980 asked the question if picking, in conjunction with timber harvesting, was endangering berry supplies for future generations! But berries aren’t their only passion—hunting, fishing, and hiking are also high on the list.

Since transitioning from an rural society to an urbanized one between 1930 and 1970, Sweden’s forests have also undergone significant changes. As people no longer required a woodlot for self-sufficiency, industrial logging intensified. Timber companies reduced time between cutting from hundreds of years to 60 or 80. They also favored fast growing pines and spruces at the expense of old growth and deciduous species. After large clearcutting operations, companies replaced mixed age, mixed species stands with monocultures. With rising environmental awareness, practices changed in the 1990s, and clearcut sizes decreased while deciduous tree populations grew.

The Swedes’ deep devotion to the forest is hard to shake, and despite moving to the city, Swedes remain attached to their time outdoors. Still, the way they used the forest changed. Two surveys, one in 1977 and the other in 1997, illustrate this nicely. By 1997, more people frequently visited—more than three times a week, perhaps to retain some connection to nature. Yet at the same time, berry picking wasn’t very popular, except for people in the older age groups. That’s not to say the Swedes lost their taste for berries—the average respondent picked 4.5 liters in 1997. But it’s apparent that berry picking is a pastime that’s slowly being lost in the bustle of city living.

The authors suspect the shift is because older generations still retain personal bonds to the countryside. While older Swedes may not have lived in the country themselves, perhaps they had relatives who did. Younger people were born in the city, and do not share the same attachment to specific locales. For them, any forest will suffice.

Indeed, the study also found evidence of this, albeit in a roundabout way through the distances people had to travel to get to a forest, which both rose and fell. The proportion of very short visits and very long visits dropped, while medium length visits (3-4 km) rose. The authors postulate a few reasons for this dichotomous change. Most people currently live further from the forest than their predecessors, reducing the number of very short distance trips. At the same time, these people may not have an affinity for one particular forest over another, and so do not travel as far to undwind. The rise in medium length visits merges these effects—increased physical and emotional distance from the forest.

As an American, I’m struck by two things: The level of access Swedes have to their forests, and their commitment to them. Both are captured by a simple fact. Just a few miles from central Stockholm, a city of 850,000, large forests remain.

Sources:

Axelsson, A. (2001). Retrospective gap analysis in a Swedish boreal forest landscape using historical data Forest Ecology and Management, 147 (2-3), 109-122 DOI: 10.1016/S0378-1127(00)00470-9

Convention on Biodiversity. 2011. Country Profile – Sweden.

Linder, P., & Östlund, L. (1998). Structural changes in three mid-boreal Swedish forest landscapes, 1885–1996 Biological Conservation, 85 (1-2), 9-19 DOI: 10.1016/S0006-3207(97)00168-7

Lindhagen, A. (2000). Forest recreation in 1977 and 1997 in Sweden: changes in public preferences and behaviour Forestry, 73 (2), 143-153 DOI: 10.1093/forestry/73.2.143

Kardell, Lars (1980). Forest mushrooms and berries—an endangered resource? Ambio, 9 (5), 241-247

Photo by Kjell Eson.

Related posts:

Managing landscapes for aesthetics

The woods that were

Thinking about how we think about landscapes

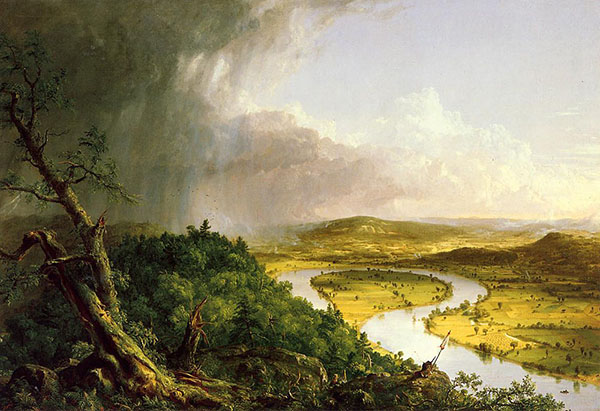
Thomas Cole - View from Mount Holyoke, Northampton, Massachusetts, after a Thunderstorm (The Oxbow)

Take a look at the painting above. It’s one of Thomas Cole’s most famous works, commonly known as The Oxbow.¹ It’s got a little something for everyone. A twisted old tree. A menacing thunderstorm. Soaring cumulonimbus clouds. A spot of sunlight. A meandering river. Well manicured farm fields. I could go on and on.

Part of the genius behind Cole’s Oxbow is that it appeals to various cognitive processes that draw us into a landscape. There have been a few frameworks proposed to study how we perceive landscapes, one of which was devised by Rachel and Stephen Kaplan, a husband and wife team in Michigan. The Kaplans’ theory is based on experiments with numerous collaborators where they surveyed the reactions of participants to various landscapes.

After poring over the data, the Kaplans noticed two cognitive processes—understanding and exploration—stood out. Within those processes, they further classified the way we react to different landscapes. Coherence and complexity are different ways we understand a scene, how we make sense of it based information that is physically present. Legibility and mystery are two ways we explore a landscape, how we extrapolate information where detail is lacking. Cole’s painting elicits in us a reaction to each of these, but one more so than the others. And that is precisely why it lures us in.

The Kaplans’ theoretical framework for landscape perception is a four-square of variables, with coherence occupying the upper left corner. Cole checks this first box with ease. As with all great art, The Oxbow displays a subtle orderliness that, while not necessarily obvious, balances the painting—the turbulent air and tortured trees give way to the glassy, defined river and neatly delineated farm fields—while imbuing it with suspense—our eyes sweep downwards from the dark clouds in upper left, following the trunk of the tree and canopies behind it down to the banks of the river, which disappears out the lower right.

From there our eyes are free to roam the details, picking out the umbrella jutting out from a promontory. Or following the slope back to find Cole himself tucked next to a rock, painting that very scene. Or the clearcuts on the hillside in the background. These details enliven the painting with complexity, which happens to be the Kaplans’ second variable, nestled in the upper right of their square. Our brain delights in such complexity, which is complexity with order. The bright river curling through the center of the painting, anchors the scene, giving order to the surrounding commotion. If we are ever overwhelmed with detail, we can always find our way back to the great silver arc. The availability of such landmarks also happens to be another of the Kaplans’ pillars, the somewhat oddly named legibility. Legibility is our ability to navigate a landscape within our brain. We rarely get lost in “legible” landscapes, but can be hopelessly disoriented in busy, messy ones.

That leaves us with one square still undefined. It is what the Kaplans consider to be the most important part of landscape perception, and the reason why I think so many people find The Oxbow so captivating. Mystery. The Kaplans define it as the “promise of new but related information”, and Cole’s painting has it in spades. The gusty thunderstorm provides motion to the scene, promising to upend the tranquility of the valley, or perhaps topple another tree. The dim, hazy horizon hints doesn’t reveal the remainder of the scene, instead leaving the viewer to discover it in his or her imagination. The river, too, hints that more lies beyond the frame.²

The Oxbow is a case of art imitating life more than a century before life caught up with a theoretical cognitive framework for studying landscape perception. Thomas Cole enshrined in oil and canvas a perfect landscape to delight our brains. In a way, it was an easy task to accomplish—after all, it’s an idealized scene. Replicating such complexity, motion, comfort, and mystery in real landscapes is much more difficult. Yet as we continue to modify the natural world apace, that is exactly what we will have to do if we want more than willy-nilly weeds. Just the other day, the National Park Service announced that it would be removing some Ponderosa pines from the floor of Yosemite Valley to restore the grand vistas of El Capitan. Such management also has an ecological benefit, restoring prairies that disappeared when fire was eliminated a century ago. But it is also a harbinger of what seems to be inevitable—the complete human management of the world’s ecosystems.

As we turn the world into our canvas, important choices will have to be made. Which ecosystems do we value at the expense of others? Who decides which ones have value? What tools will we use, and what is our vision? From my brief scan of the mighty stack of research on landscape perception, it’s clear that not everyone will have the same opinions. But there do seem to be hints of universality here and there. It will be a long time before we discover which landscapes, if any, bind us together. But in the meantime, I’ll be sifting through the papers, sharing my thoughts along the way. Stay tuned.


  1. The actual title is far longer, more Romantic with a capital R, and less catchy: View from Mount Holyoke, Northampton, Massachusetts, after a Thunderstorm.
  2. It seems to be flowing to the lower right corner, though I have no way of knowing this for certain except that it just feels right. I suspect Cole knew this.

Source:

Kaplan, R., Kaplan, S., & Brown, T. (1989). Environmental Preference: A Comparison of Four Domains of Predictors Environment and Behavior, 21 (5), 509-530 DOI: 10.1177/0013916589215001

Related posts:

Managing landscapes for aesthetics

This is your brain in the city

Scientific American Guest Blog: Why we live in dangerous places

Coaxing more food from less land

wheat ears

It’s easy to forget amidst the concern over sprawl that agriculture is still the dominant human impact on the land. Perhaps that’s because it’s easy to rationalize the consequences of agriculture’s land use—it feeds us, after all. But that shouldn’t dissuade us from finding ways to improve farm efficiency. Global population growth shows no signs of stopping before 2050, and rising standards of living mean everyone will be consuming more calories than ever. And why shouldn’t many of them? Malnutrition still plagues much of the developing world.

That’s not to say we haven’t made progress. The Green Revolution boosted crop production by between 250 and 300 percent while only using about 12 percent more acreage. This put a serious dent in starvation rates, but it hasn’t been enough to eradicate the problem nor will it be enough to keep it at bay in the future. Troublingly, crop yields have begun to level off, raising concerns that the the only way to meet the inexorably rising demand will be to put more land under cultivation.

As a humanitarian and conservationist, both prospects alarm me. I’m not alone. Jason Clay, a vice president at the World Wildlife Fund, published an essay in the latest issue of Nature raising many of the same concerns. He offers eight strategies to alleviate the problem, all of which are forward thinking but only some of which will be easy to implement. Clay also focuses intensely on how these strategies can help Africa, a continent in dire need of more productive agriculture, as you can see in a worldwide map of crop yields (cereal yields are mapped below). He also rightly points out that those strategies need to be implemented in the developed world. But Clay fails to say how doing so will benefit nations developed and developing. That’s where I’d like to step in.

World cereal yields (2009)

view larger
view interactive version

Clay’s eight strategies run the gamut. The careful study of genomes can lead to greatly improved yields. But his approach is different in a subtle yet important way from many genetically modified crops. Rather than inserting genes from other organisms, he proposes geneticists speed the old process of selective breeding, where the best traits are kept and the rest discarded. He also supports training farmers in best practices, rehabilitating degraded land, reducing waste from field to table, raising the efficiency of inputs like fertilizer and irrigation, improving soil organic matter, and the reducing consumption in developed nations (which would have obvious benefits for their citizens). Clay also says giving farmers title to their land—something often absent in developing nations—would raise yields by encouraging stewardship.

Poor practices and low yields can lead to a cycle of cultivation and abandonment, which I think is part of the concern in Africa. Unless broken, some of the world’s most important ecosystems will be destroyed. Developed nations have been pushing conservation in developing nations, hoping they won’t repeat the mistakes many of us made decades or centuries ago. However, many people in developing nations have more urgent concerns, like food. Here’s where improvements in the developed world could help. Further raising crop yields in developed nations would not only allow us to save more of our land for conservation—increasing total protected area worldwide—we could direct the surpluses toward a food-for-conservation effort, similar to those proposed for carbon offsets. Such programs would require careful implementation to encourage self-sufficiency and prevent developed nations from lording over the poor.

Developed nations should also look inwards to expand their crop production before going abroad. That’s not to say developing nations should abandon the export market. Crop exports do provide poor nations with cash. But there is a growing trend of foreign interests purchasing cropland and exporting the harvests, removing local farmers and reducing the value of exports to the local economy. For example, China, India, and other countries have purchased or are leasing large tracts of land in Africa for that purpose. While there are good arguments for the globalization of the food supply—increased efficiency can offset the need for new tillage—it shouldn’t be done at the expense of local farmers or virgin land.

In essence, Europe, China, North America, and other developed regions need to further raise their agricultural efficiency and lend a hand to those who are struggling to do so. That can include food aid, but should also include training, research into more sustainable agricultural techniques, and further technology transfers. Many of these already take place, but need to be more creative and larger in scale.

Implementing the same strategies in developed nations that Clay suggests for the developing world would be sensible international policy. Rather than exhorting developing nations to “make better choices” and not repeat the mistakes we made in the past, we should be putting these strategies into action ourselves. It would help fight the appearance of imperialism and perhaps lead to more trusting international relationships, sending the signal that we’re all in this together.

Sources:

Clay, J. (2011). Freeze the footprint of food Nature, 475 (7356), 287-289 DOI: 10.1038/475287a

Foley, J. et al. (2005). Global Consequences of Land Use Science, 309 (5734), 570-574 DOI: 10.1126/science.1111772

United Nations Food and Agriculture Organization. 2011. FAOSTAT 2009 Crop Data. (available online)

Photo by five blondes.

Related posts:

Can we feed the world and save its forests?

Small farms in modern times

An ecology of gardens and yards

City wildflowers

Tucked amidst acres of asphalt jungle are cities’ unsung environmental heroes. Yards, lawns, gardens—call them whatever you please—these bits of unpaved earth play a real role in supporting thriving urban ecosystems. And they could play the part even more eloquently if we thought of them as parts of a larger whole.

Anyone who has spent more than five minutes in a city knows they are not always welcoming to people, let alone plants and animals. It’s common to see thin, scrappy weeds straining against their concrete binders, or birds clinging to wiry utility lines in lieu of more customary branches and brambles. But behind houses, or even hidden out front in plain sight, are postage stamps of possibility. With all the clipping, prodding, and spraying these diced green patches receive, it’s easy to forget that they are part of a real ecosystem.

Cities have long been overlooked by ecologists, mostly because the logistics involved in studying them can be convoluted. Getting permission from dozens, even hundreds of landowners is one of the biggest headaches, so urban ecologists typically resort to the next best thing—parks, forest preserves, greenways, and so on. Parks can be fantastic reservoirs of habitat, but their area pales in comparison to the amount of land scattered throughout the city as yards and gardens. Real urban conservation plans needs to account for everyone’s little patch of nature.

Here’s where landscape ecology can help. Landscape ecology teaches us to look beyond—or within—the various bits and pieces, components and parts that make up an ecosystem. Scale is king in landscape ecology, be it spatial or temporal. In the context of a city, this means that each individual yard and garden—which on its own can seem hopelessly small, only able to support a salamander, some insects, and a few birds at best—is just one piece of a larger patchwork, one connected by birds that fly across town, salamanders that waddle beneath fences, bees that hum between flower beds, and seeds that disperse on the wind. Protecting them all is only possible when conservation plans cover the gamut of spatial and temporal scales.

Unfortunately, much of this potential has yet to be tapped. By and large, cities remain natural wastelands. Habitat fragmentation keeps down the abundance and diversity of species. Inspired landscaping can counter the diversity problem, but it usually does so with exotic species that are poor ecological substitutes for natives. Pets—especially cats—take a toll on native animal populations, while air, light, and sound pollution add further disruptions to an already taxed ecosystem.

Still, most cities have enough material for a solid conservation foundation. Many people are earnestly invested in their yards, carefully curating selections of grasses, trees, and shrubs, attracting musical entertainment through bird feeders, and in doing so supporting a diversity of mammals, amphibians, reptiles, and invertebrates. This has all been accomplished without significant coordination. Programs like the Audubon Society’s “Audubon at Home” or the National Wildlife Federation’s backyard certification scheme have nibbled at the edges, but lots more could be done.

A recent review of the landscape ecology of gardens suggests that to encourage habitat friendly yards and gardens a bottom up approach would be best. Top down programs can help cities meet conservation targets, but they do little to change people’s attitudes. Encouraging a “conservation ethic of the city” would probably be more successful, but also more difficult to engender. Lawn culture is heavily embedded in many Western nations, especially the U.S. and Canada. Lawns will always have their place; besides recreation, they are surprisingly productive ecosystems. Yet most are far larger than they need to be. Substituting appropriate plantings for classic Kentucky bluegrass would save people time and effort, reduce emissions from mowing, and boost habitat diversity and complexity.

Lawns are just one part of the equation. Landscape ecologists can step in to identify the driving forces behind landowner decisions. Where the conservation ethic exists, ecologists can encourage neighbors to coordinate their landscaping, clumping their native plantings so that four quarters can add up to one whole, for instance. Depending on the area’s ecology, landscape ecologists can further define optimal sizes for these native plots—for example, will it take twenty percent of four yards or six to meet the needs of a native bird? Or in other cases, water features like ponds may be more important than contiguity. Each city, even neighborhood, will have its own gestalt, and landscape ecologists can help discover it.

Sources:

Falk, J. (1976). Energetics of a Suburban Lawn Ecosystem Ecology, 57 (1) DOI: 10.2307/1936405

Goddard, M., Dougill, A., & Benton, T. (2010). Scaling up from gardens: biodiversity conservation in urban environments Trends in Ecology & Evolution, 25 (2), 90-98 DOI: 10.1016/j.tree.2009.07.016

Related posts:

The great (big) American lawn

Plants rockin’ the suburbs, animals not so much

Raptors in the city

Photo by Per Ola Wiberg.

Drive a lot? Housing density may not be to blame

Chicago streets at night

Pushing high density living may seem like a good way to get people out of their cars—saving them money, curbing emissions, and reducing oil dependence—but densification may not be a silver bullet, according to one recent study. The authors dug into the National Household Transportation Survey to examine per household vehicle ownership rates, vehicle miles traveled (VMT), and fuel consumption. While the results are by no means comprehensive or conclusive, they suggest that only the steepest increases in density could reduce car usage.

This post was chosen as an Editor's Selection for ResearchBlogging.orgDespite a correlation between density and car usage, other factors seem to play more important roles. Density is responsible for a fraction of annual VMT; increasing density by 1,000 housing units per square mile—a titanic leap, given that the average household is 2.6 people—reduces VMT by just 1,171 miles, all else being equal. Since that the average one-driver household in the study tacks on 10,100 miles per year, that represents just over an 11 percent drop in annual mileage.

housing density and Vehicle Miles Traveled

If you look at the numbers another way, the case for density reducing car usage looks even more tenuous. VMT only really declines substantially at the highest housing density—over 5,000 units per square mile, or about the same as Chicago. To halve VMT of the highest mileage households, you would need to increase housing density in those areas by 20- to 100- fold.

The inflexibility of our automobile usage boils down to a few factors, with work being the most important. The more workers in a household, the more drivers, and the more drivers, the more miles. A one-driver household, as noted above, tallies 10,100 miles per year; a two-driver household racks up 18,800 miles; three drivers, 33,900; four drivers, 47,700.¹ We are, by and large, beholden to our cars because we are beholden to our jobs. After that, driving increases as a result of income (richer people drive more), number of children (more and larger cars), education (higher education means more cars), and people’s life stage (households with older children have more cars).

While higher housing density doesn’t seem to reduce VMT, it does drive down fuel consumption. Households in the 50 to 250 houses per square mile range use 1,650 gallons of fuel annually, the most of any group. Every other group uses far less fuel. In the big cities, fuel usage drops to 690 gallons per household per year.² The reason? People with the space to use pickup trucks, SUVs, and vans tend to buy them more than people who live and drive on tighter city streets—they typically drive smaller, more fuel efficient vehicles. Yet this trend could be changing as we speak. Small car purchases have been increasing across the country, and anecdotally at least, I can confirm that large pickup trucks are harder than ever to sell these days.

fuel consumption and Vehicle Miles Traveled

One of the main arguments behind higher density living is that it will reduce our carbon footprint. While density may be a better long term solution, right now the most expeditious approach is to increase fuel economy. Rebuilding neighborhoods will take decades. In that time, most people will buy at least a handful of new cars, primarily for commuting to work. It would be great if everyone had access to mass transit, but for many, mass transit isn’t just a poor option, it isn’t an option at all. Those who do travel by bus or train today may only be a job change away from having to drive. Modern life demands mobility, and few things are better at providing that than the automobile.


  1. The increase from one to two drivers probably reflects some combining of trips by couples or roommates. The sharp increase from two to three drivers is probably the result of a family’s children driving to school or work.
  2. The lone outlier is areas below 50 houses per square mile, where households use 1,200 gallons per year. They probably have fewer nearby destinations, and so stay home more often.

Source:

Brownstone, D., & Golob, T. (2009). The impact of residential density on vehicle usage and energy consumption Journal of Urban Economics, 65 (1), 91-98 DOI: 10.1016/j.jue.2008.09.002

Photo by dsearls.

Related posts:

Tell me how much you drive, and I’ll tell you where you live

Urbanites leave the car behind, but not as often as might think

Why the poor live in cities