The things people want and need are often far away from where they live. It’s a bit of geographic inequality that applies to all of us. The U.S. trade deficit with China is one example of the problem. Another is ecosystem services.
Ecosystem services range from clean water to fresh air to crop pollination and many more. Even the big tree shading your house or apartment building is providing an ecosystem service. The list is so long that most scientific studies suffice with a subset. Healthy ecosystems provide them at no cost to us, but if we were forced to replicate the services ourselves, it would cost us at least $24 trillion annually.¹ Global gross domestic product in 2009 was $58 trillion. In other words, we’d have to commit nearly half of the global economy to replicating ecosystem services if they were lost. In other, other words, we can’t afford to lose them.
The real wrinkle with ecosystem services is that many are most needed where they are most difficult to preserve—in dense urban areas. That’s what a 2009 study investigating the geographic disparity between supply and demand of ecosystem services found. The study’s author built a model to determine which lands would be most economical to purchase to provide a given service. He based the model on bid-rent theory, which describes how much money people are willing to pay for property close to downtown. The closer to downtown, the higher the rents. The model also takes into account the ease with which each ecosystem service can be “transported,” or the distance at which the ecosystem service remains beneficial. Using these two costs, the author attempts to find the sweet spot where governments and conservation groups can get the most bang for their buck.
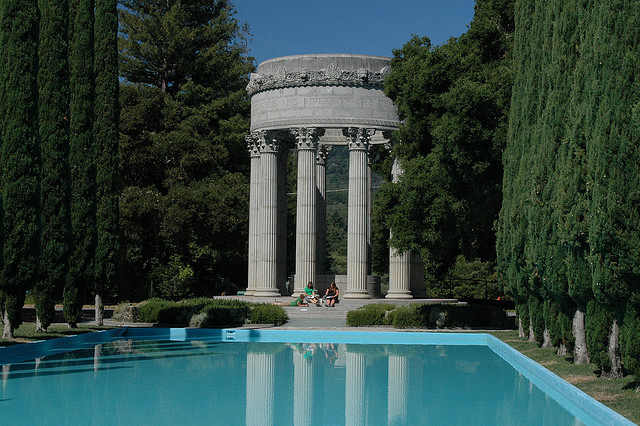
What he found was that the most desirable land and the distance at which it is effective depends on the service in question. For something like clean drinking water, for example, the best land may not be the closest. Take San Francisco’s water supply, which comes from the Hetch Hetchy watershed. Hetch Hetchy is hundreds of miles from the city, but aqueducts allow the benefit of the ecosystem service to be transported to San Franciscans’ taps.²
Parkland, on the other hand, is not as readily transportable. For people to enjoy a park, it needs to be within a reasonable distance from their homes. The study found that the best parks—those that have the highest recreational value in the model—were those closest to the city center. Recreational value diminishes with distance from the city center, out to about 5.4 miles (10 km) from downtown. After that, one park is just about as much fun as any other.
The sweet spots are those that can protect two, three, or more ecosystem services. For example, a forest set aside as a regional park on the outskirts of a city can provide clean drinking water, reduce runoff to mitigate flooding, store carbon, and preserve biodiversity. This is, however, a best case scenario. The authors of a 2006 paper reports that, in their study area, only a select few patches of land could support four or more ecosystem services.
Governments and organizations looking to protect ecosystem services must spend their money wisely, allocating it where the most people will derive the most benefit for the least amount of money. Where those paths cross may not be obvious, though.³ Ultimately, the answer will come down to the value we place on each ecosystem service.
- Based on the results of Costanza et al. and adjusted for inflation to 2009 dollars. ↩
- That’s not to say the flooding of Hetch Hetchy is a net benefit for ecosystem services overall—merely that the fresh water service can be provided from hundreds of miles away. ↩
- By way of example, San Francisco set aside $150 million in 2000 to purchase parkland within the city, even though there was only an estimated 355 acres (144 ha) of undeveloped available. By contrast, Sonoma County, just to the northeast of San Francisco, has spent $200 million to protect nearly 70,000 acres (28,300 ha). Does that mean San Francisco is wasting its money? Not necessarily. By adding parkland within city limits, where 17,323 people live per square mile, each acre is benefitting far more people than an acre in Sonoma County, where only 290 people live per square mile. ↩
Sources:
McDonald, Robert I. (2009). Ecosystem service demand and supply along the urban-to-rural gradient Journal of Conservation Planning, 5, 1-14. (available online)
Chan, K., Shaw, M., Cameron, D., Underwood, E., & Daily, G. (2006). Conservation Planning for Ecosystem Services PLoS Biology, 4 (11) DOI: 10.1371/journal.pbio.0040379
Costanza, R., d’Arge, R., de Groot, R., Farber, S., Grasso, M., Hannon, B., Limburg, K., Naeem, S., O’Neill, R., Paruelo, J., Raskin, R., Sutton, P., & van den Belt, M. (1997). The value of the world’s ecosystem services and natural capital Nature, 387 (6630), 253-260 DOI: 10.1038/387253a0
Photo by km6xo.
About the image: The Pulgas Water Temple was built in the 1930s at the terminus of the Hetch Hetchy aqueduct. Before 2004, water from the aqueduct flowed through the temple before traveling on toward San Francisco.